Base Supply (S0) stood at $290.42B on 31 October 2026, down from $299.30B on 30 September 2026, a 2.97% decline that reversed the prior month’s rise. USDT’s share of Base Supply rose from 61.47% to 61.91%, while USDC’s share edged down from 24.87% to 24.74%. Among constituents pr
Size & Growth
- Base Supply (S0)
- $290.42B31 Oct 2026
- Net change
- −$8.87B-2.97% over month, incl. $4M into coverage and $568M out of coverage
- Top gainer
- United Stables+$109M, continuing constituents
Composition & Dominance
- USD-pegged
- 99.6%of Base Supply (S0)
- USDT share
- 61.9%of Base Supply (S0)
- Issuer HHI
- 4,476+48 MoM
Regulation & Stability
- GENIUS-compliant
- $74.87B25.8% of Base Supply (S0)
- MiCA-compliant
- $75.56B26.0% of Base Supply (S0)
- Avg peg score
- 94.01 coin off-peg on 31 Oct 2026
Contents
- News & Developments
- Analysis & Commentary
- Market Structure & Supply
- Concentration & Competition
- Regulatory Compliance (GENIUS & MiCA)
- Peg Currency & Dollarization
- Peg Stability & Risk
- Trading Activity & Turnover
- Network Distribution
- Yield-Bearing & Tokenized-Dollar Instruments
- Cross-Currents
- Macro & Crypto Backdrop
News & Developments
Regulation led October’s stablecoin news, with the OCC finalizing GENIUS Act rules for issuers and custody, ESMA asking national regulators to require firms to address exposures to non-compliant stablecoins within 3 months, and Canada opening consultation on draft rules. Payment infrastructure also expanded, with Mastercard and BVNK launching a platform for fiat and stablecoin balances, and Circle partnering to bring USDC and EURC into SAP payment workflows.
Regulation & Policy
Regulatory attention centered on implementation and perimeter-setting: the OCC finalized GENIUS Act rules for stablecoin issuers and custody, while ESMA asked national regulators to require crypto firms to address exposures to non-compliant stablecoins within 3 months. Canada opened a consultation on draft rules for non-bank stablecoin issuers that would cap redemption fees at 1% and bar paying interest for holding a coin. In Europe, Circle pushed back on MiCA’s bank-deposit mandate for stablecoins, and the French National Assembly adopted a tax on crypto-to-stablecoin swaps, after its finance committee had backed the tax and then rejected the budget’s revenue section; proposals for an exit tax and for reporting self-custodial wallets remained under consideration. Tether-related scrutiny also persisted, with a lawsuit over a $2.76 million stablecoin freeze and two letters from Senator Richard Blumenthal requesting records: one to Cantor Fitzgerald about its Tether ties, and one to Tether about a reported deal with a company co-founded by a former Trump crypto adviser.
Issuance & Launches
Issuance activity included Qivalis receiving EMI authorization from the Dutch central bank for a euro stablecoin, while SoFi launched a tokenized deposit paying 4.4% that holders can convert into SoFi’s own stablecoin. Injective and BDACS planned Korean won stablecoin settlement for tokenized assets, and Anchorpoint, a Standard Chartered and Animoca Brands joint venture, said it was not rushing retail access to its Hong Kong dollar stablecoin.
Adoption & Partnerships
Payments and bank-facing integrations were the main adoption developments. Mastercard and BVNK launched a “Global Money Platform” that lets businesses hold fiat and stablecoin balances and pay from them by card or bank transfer, and Mastercard launched a fraud-screening tool for stablecoin payments. Circle partnered with Tereina, an SAP-backed company, to bring USDC and EURC into SAP payment workflows, with customer testing planned, while Standard Chartered launched Ripple USD custody in Dubai and plans to let clients use it as trading collateral without moving it. In related issuer partnerships, Tether signed an agreement with Kazakhstan’s central bank to explore a tenge stablecoin and asset tokenization, Tether backed a Bolivian fintech bringing USDT payments to food delivery and banking, and Robinhood and Ripple expanded a partnership to bring RLUSD to retail and institutional markets.
Incidents
Incident coverage centered on freezes and asset movement after hacks. World Liberty’s USD1 stablecoin shed $400M in market cap in two weeks. After the Binance hack, the attackers raced to convert stolen stablecoins into assets issuers cannot freeze, while Circle froze $823 million in USDC and the FBI said it was working on the case. In India, CoinDCX confirmed a $16 million loss in USDT from wallets it had retired after an earlier hack.
Other developments
Tether reported that its excess reserves nearly doubled to $8B and that its third-quarter operating profit reached $1.5B.
Analysis & Commentary
The program published the following analysis of October 2026.
After the Freeze: What Happens to Blacklisted Stablecoins? · 3 November 2026
About an hour after Binance’s hot wallets were compromised on October 29, Tether and Circle blacklisted the same Ethereum address, freezing about 971 million USDT and 823 million USDC. Neither issuer burned the tokens. They stayed at the address, unable to move, and the USDT balance kept growing as another 204 million arrived after the freeze.
By November 3 the address held about 1.175 billion USDT and 823 million USDC, still blacklisted by both issuers. This article reconstructs that sequence from the Ethereum contracts themselves, shows why the time each issuer took to act depends on where the clock starts, and proposes a simple way to track frozen balances over time: the amount held under restriction multiplied by how long it stays there. A freeze stops funds from moving, while recovery is a separate question the blockchain alone cannot answer. Full analysis: stablecoinbeat.com/insights/after-the-freeze-blacklisted-stablecoins/
Market Structure & Supply
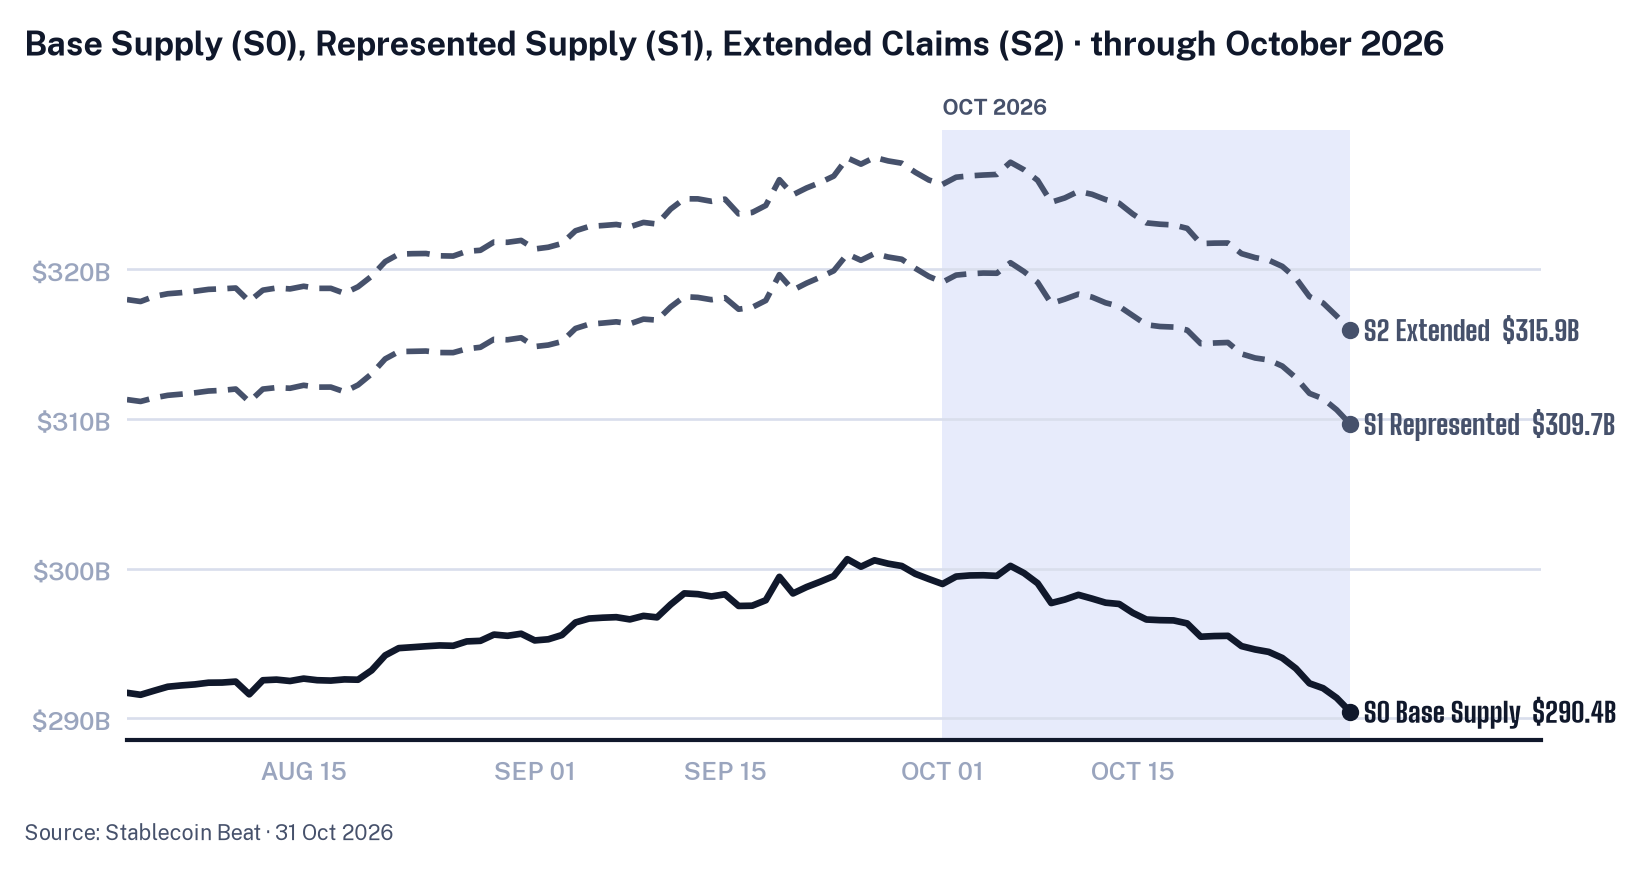
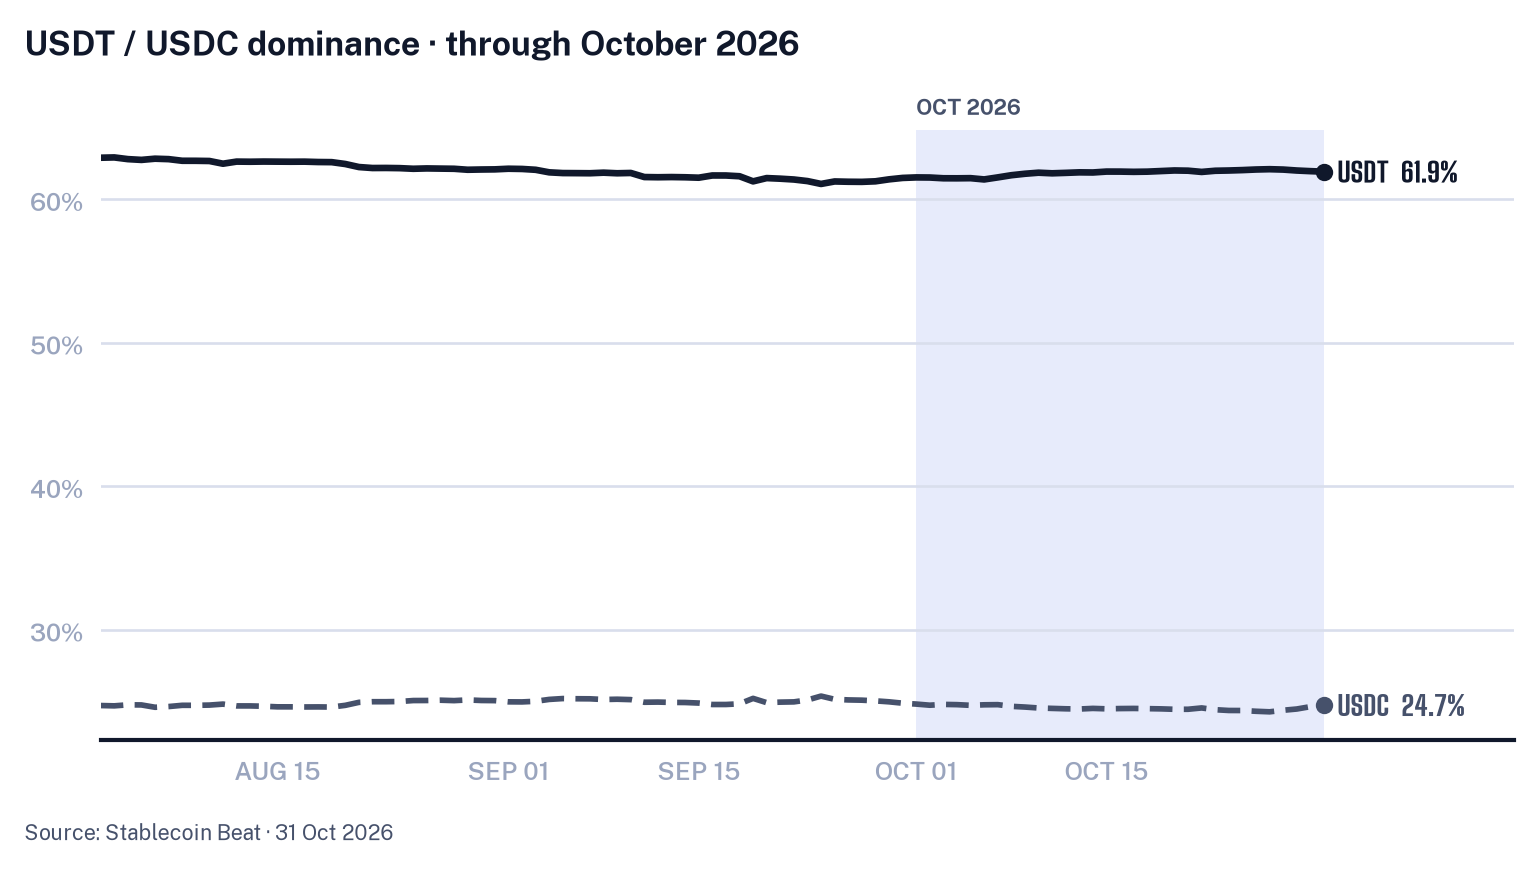
Base Supply (S0) stood at $290.42B on 31 October 2026, down from $299.30B on 30 September 2026, a 2.97% decline that reversed the prior month’s rise. USDT’s share of Base Supply rose from 61.47% to 61.91%, while USDC’s share edged down from 24.87% to 24.74%. Among constituents present at both month-ends, USDT’s share moved from 61.59% to 61.91%, and USDC’s share from 24.92% to 24.74%. Above Base Supply, Represented Supply (S1, gross) decreased from $319.52B to $309.65B, a 3.09% move, and Extended Claims (S2, gross) decreased from $325.97B to $315.93B, a 3.08% move. The representation multiplier was little changed, at 1.088 on 31 October 2026 after 1.089 on 30 September 2026.
Over the month, Base Supply declined 3.0%, a move 2.2 times its typical 30-day variation. USDT accounted for 47% of that move and USDC for 29%, while USD1 accounted for 6%. A further 6% reflected Gate USD and 15 smaller constituents leaving coverage under the published constituent decisions on 7 October 2026. Gate USD had contributed $320M at the prior month-end; the 15 smaller constituents had contributed $248M together, for a combined $568M across 16 constituents.
Among constituents above $1B, the largest percentage declines were in USD1, down 12.2% and -$542M over the month to $3.89B, and Ethena USDe, down 7.6% and -$369M to $4.51B. Global Dollar declined 6.0% and -$187M to $2.92B, Ripple USD declined 4.0% and -$101M to $2.42B, and USDS declined 3.8% and -$257M to $6.45B. Gains were concentrated in United Stables, up 7.3% and $109M to $1.61B, USDGO, up 6.4% and $76M to $1.26B, and PayPal USD, up 3.5% and $96M to $2.82B. United Stables and Ripple USD also had monthly averages 2.5 times their typical variation above their trailing 12-month averages.
USDD recorded the month’s sharpest daily supply moves. It rose 11.82% day over day on 11 October 2026, with the standardized move at positive 3.6 times its typical variation, and then fell 14.95% day over day on 28 October 2026, with the standardized move at negative 4.6 times its typical variation.
Concentration & Competition
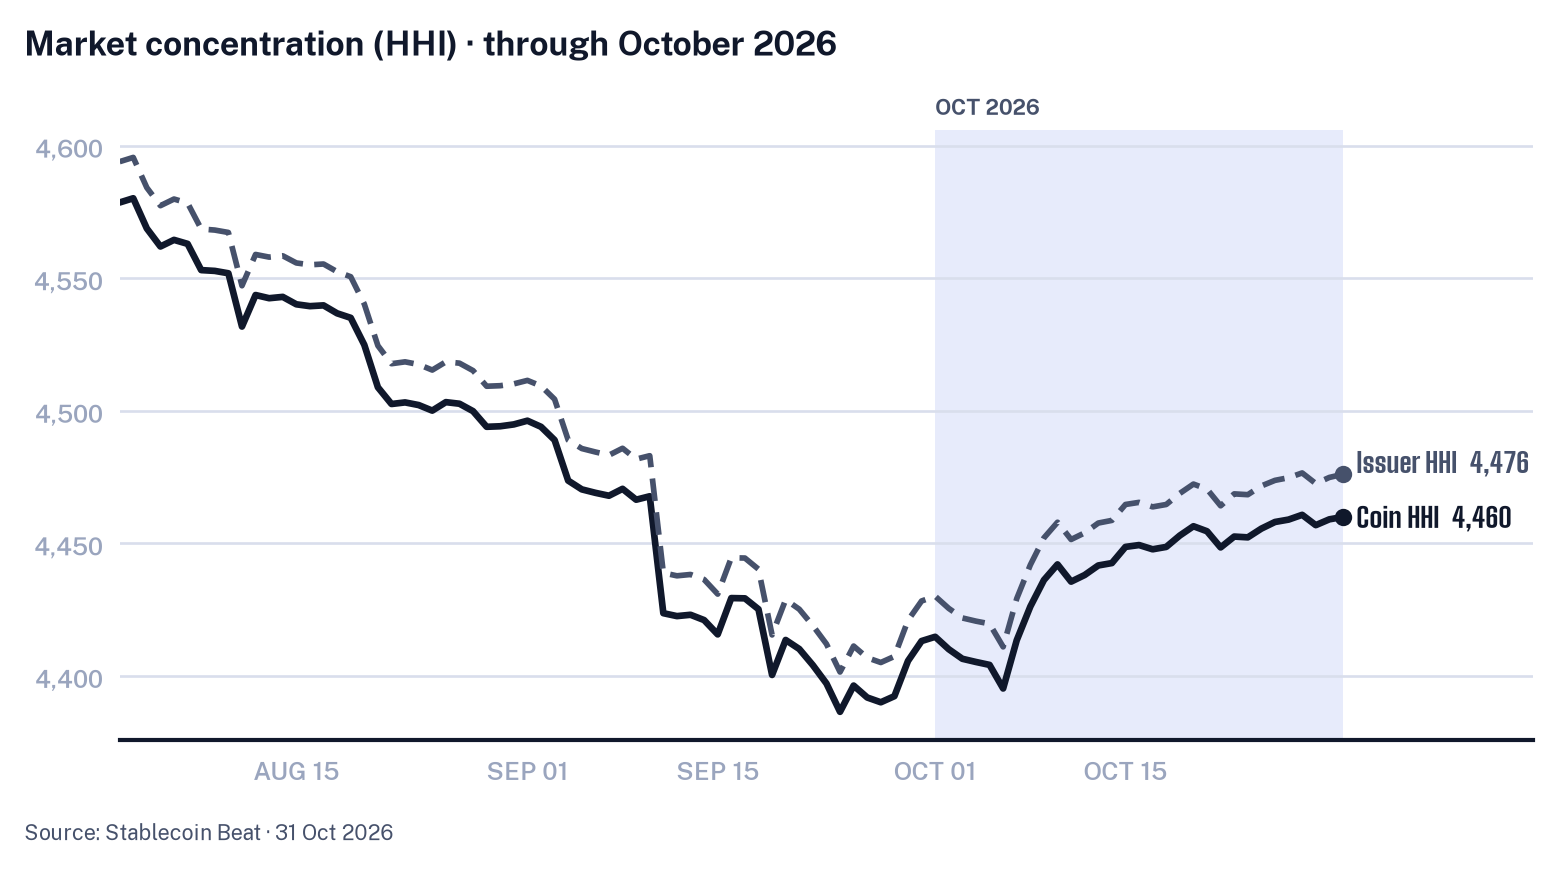
Concentration stood higher at month-end. The market HHI rose from 4,413 on 30 September 2026 to 4,460 on 31 October 2026, a 1.06% increase that reversed September’s decline. The issuer HHI moved similarly, rising from 4,428 to 4,476, up 1.08% and also reversing the prior month’s decline. The issuer Theil index fell from 3.70 to 3.63, but the whole fall came on 7 October 2026, the day constituents left coverage under the published constituent decisions; excluding that day, it rose slightly.
The common-constituent measure gave a similar concentration read. Among constituents present at both month-ends, the market HHI rose from 4,430 on 30 September 2026 to 4,460 on 31 October 2026; against the headline move from 4,413 to 4,460, coverage changes barely moved concentration.
Regulatory Compliance (GENIUS & MiCA)
| Coin | 30 Sep 2026 | 31 Oct 2026 | Change |
|---|---|---|---|
| USDC | $74.44B | $71.85B | -3.5% |
| PayPal USD | $2.72B | $2.82B | +3.5% |
| USAT | $183M | $180M | -1.6% |
| Pax Dollar | $26M | $22M | -13.7% |
| Coin | 30 Sep 2026 | 31 Oct 2026 | Change |
|---|---|---|---|
| USDC | $74.44B | $71.85B | -3.5% |
| Global Dollar | $3.10B | $2.92B | -6.0% |
| EURC | $466M | $504M | +8.3% |
| EUR CoinVertible | $186M | $191M | +2.9% |
| Eurite | $38M | $36M | -3.1% |
At the end of October, GENIUS Act-compliant supply, based on current constituents and valued in Base Supply (S0), stood at $74.87B, or 25.8% of Base Supply (S0), after a 3.2% decline since 30 September 2026. MiCA-compliant supply stood at $75.56B, or 26.0% of Base Supply (S0), after a 3.5% decline over the same period.
The two cohorts are not additive: USDC makes up most of each. USDT, the largest constituent, appeared in neither published cohort. These cohorts were published category classifications, without any legal-determination claim attached.
Peg Currency & Dollarization
| Currency | End of month | % of S0 | Avg (month) | vs prev month |
|---|---|---|---|---|
| USD | $289.32B | 99.62% | $295.36B | ▼ -0.5% |
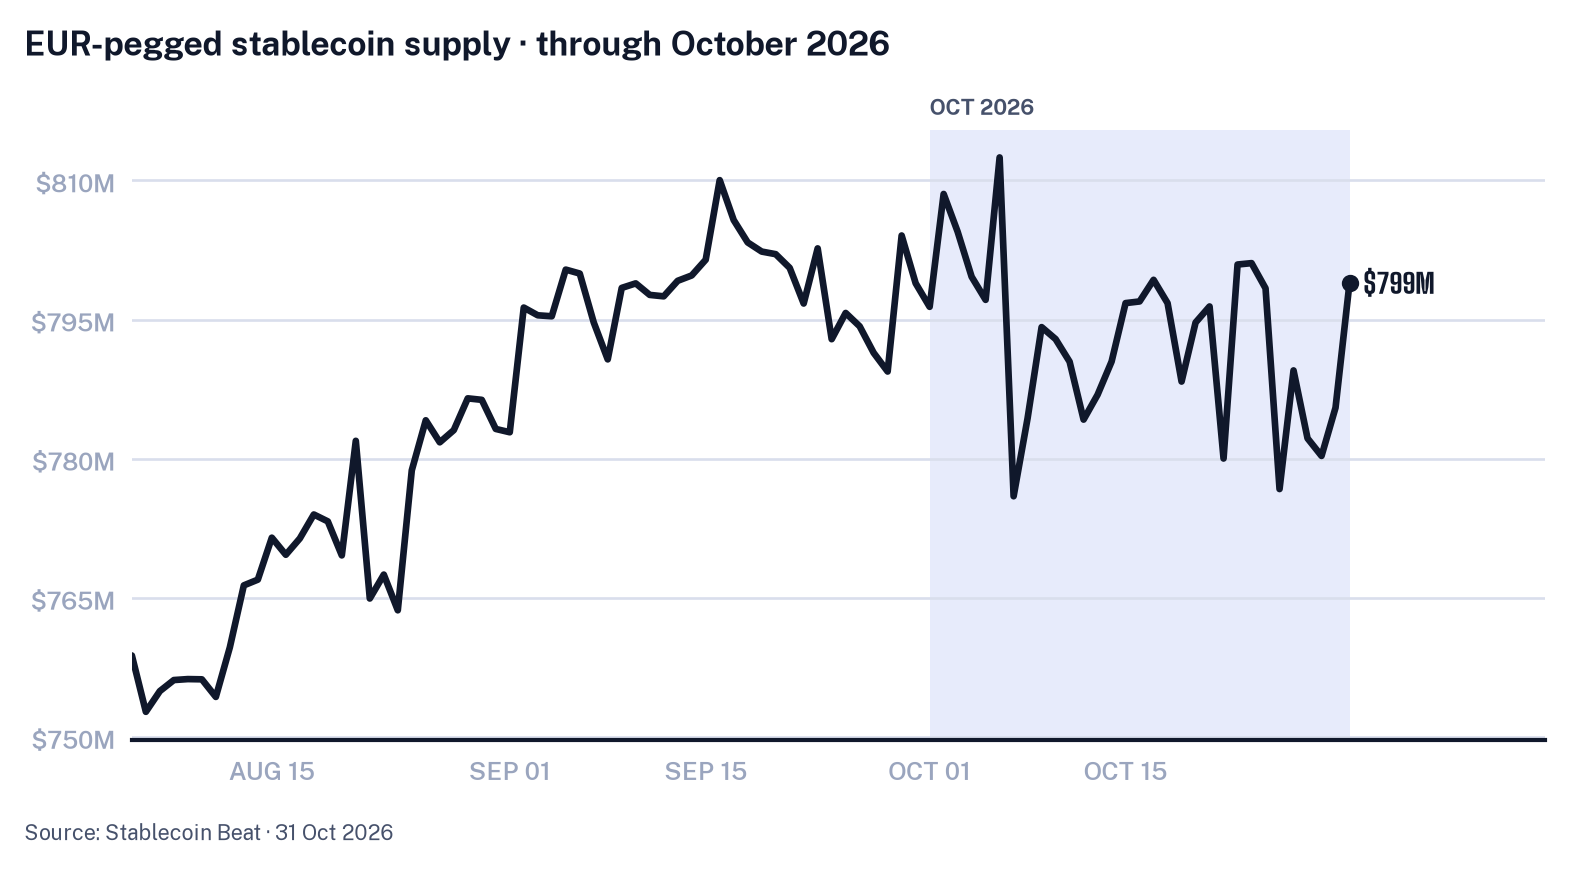
| EUR | $799M | 0.28% | $793M | ▼ -0.6% |
| JPY | $150M | 0.05% | $150M | ▲ +2.0% |
| CHF | $46M | 0.02% | $45M | ▲ +0.6% |
| BRL | $44M | 0.02% | $34M | ▲ +20.0% |
| GBP | $28M | 0.01% | $27M | → -0.3% |
| SGD | $13M | 0.00% | $13M | ▼ -0.7% |
| AUD | $13M | 0.00% | $14M | ▼ -8.1% |
At the end of October 2026, USD-pegged stablecoins accounted for 99.62% of Base Supply, leaving peg composition overwhelmingly dollar-denominated. The market remained, in substance, a dollar instrument.
The non-USD segment was a long tail. EUR-pegged supply stood at $799M, the largest non-USD peg, and most euro supply was in MiCA-compliant coins. Other currency pegs, including GBP, CHF and JPY, remained small.
Peg Stability & Risk
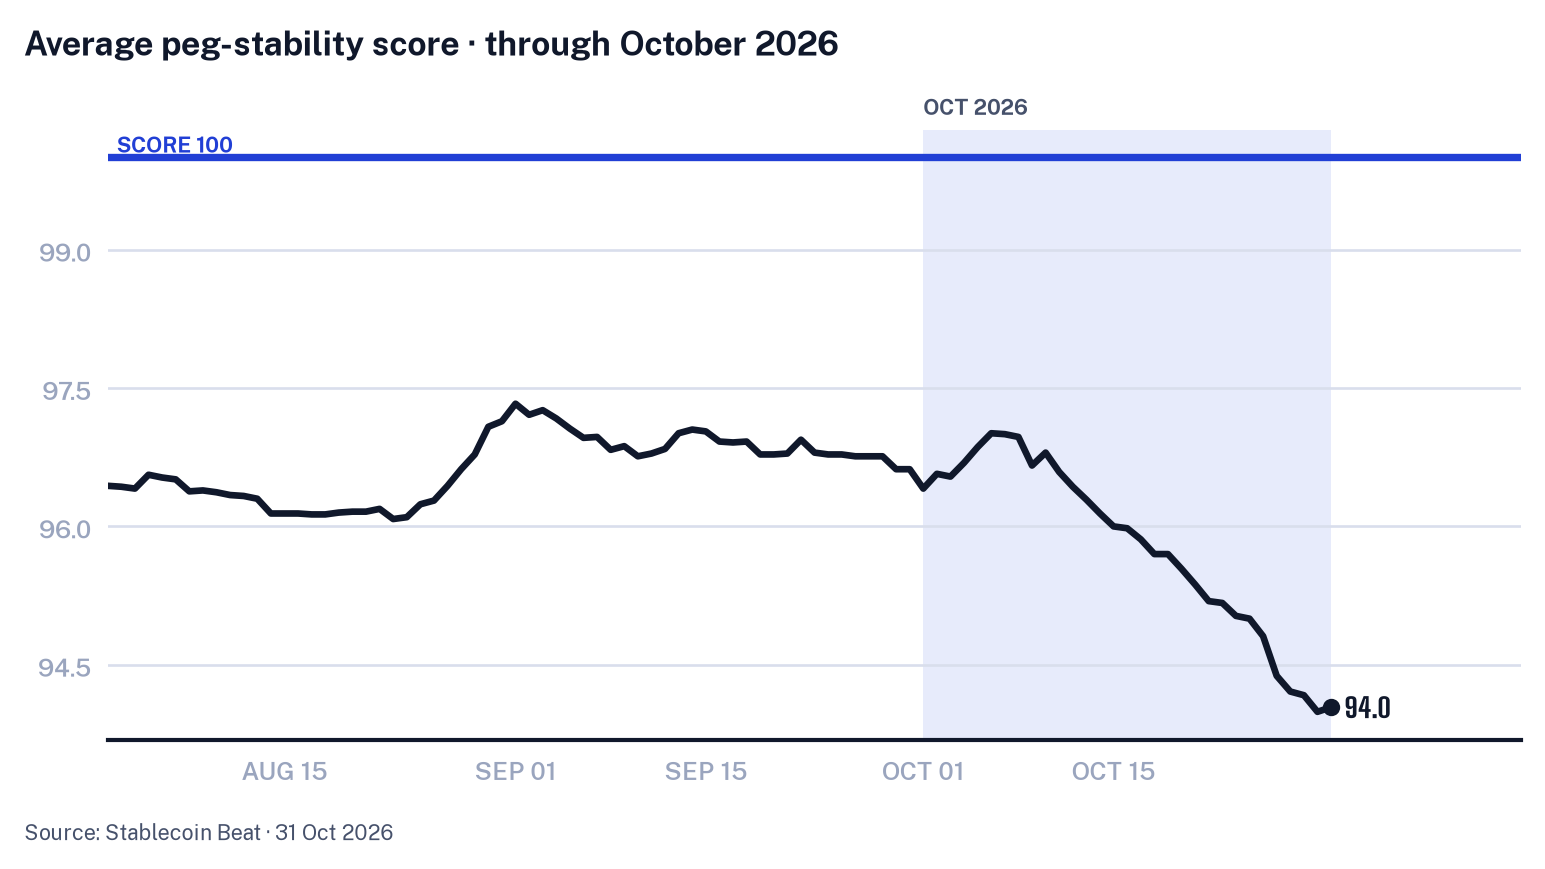
The average peg score is a 0-100 stability score: 100 means a coin held $1.00 all month, while lower values capture drift and off-peg days. It covers only dollar-pegged coins; euro- and other-currency stablecoins are outside the measure because they would require an FX reference. The score fell from 96.6 on 30 September 2026 to 94.0 on 31 October 2026, a 2.6-point decline and a second consecutive monthly fall. Coins off-peg rose from 0 to 1 (Falcon USD) over the same endpoints, while the worst deviation increased from 0.419% to 0.999%, also rising for a second consecutive month. Thirty-day depeg events rose from 11 to 25, extending the prior month’s increase.
Off-peg days recurred through the month: at least one coin was off-peg on 24 of 31 days, Falcon USD on most of them. Depeg event counts later reached 25 on 30 October 2026, also for two days.
Trading Activity & Turnover
| Coin | Base Supply (S0) | 24h volume | Turnover |
|---|---|---|---|
| USDT | $179.79B | $38.46B | 21% |
| USDC | $71.85B | $10.03B | 14% |
| Global Dollar | $2.92B | $386M | 13% |
| Ripple USD | $2.42B | $175M | 7% |
| USD1 | $3.89B | $226M | 6% |
| USDS | $6.45B | $301M | 5% |
| United Stables | $1.61B | $57M | 4% |
| EURC | $504M | $18M | 3% |
Across the 17 constituents with unambiguous traded-volume series, representing 98.2% of Base Supply, 24-hour traded volume stood at 17.5% of their base-supply value on 31 October 2026.
October recorded no turnover event.
Network Distribution
| Network | End of month | Avg (month) | Range (min – max) | vs prev month |
|---|---|---|---|---|
| Ethereum | $140.24B | $144.13B | $140.24B – $146.66B | ▼ -1.7% |
| Tron | $93.79B | $94.24B | $93.59B – $94.97B | → +0.4% |
| Solana | $15.12B | $15.83B | $15.02B – $16.61B | ▼ -1.1% |
| BSC | $13.09B | $13.47B | $13.07B – $13.86B | ▼ -0.6% |
| Hyperliquid L1 | $6.73B | $7.12B | $6.73B – $7.47B | ▼ -1.0% |
| Base | $5.06B | $5.14B | $5.04B – $5.25B | ▲ +3.3% |
| Arbitrum | $3.59B | $3.71B | $3.52B – $3.94B | ▲ +0.7% |
| Polygon | $2.87B | $2.89B | $2.82B – $2.97B | ▼ -3.9% |
| X Layer | $1.39B | $1.53B | $1.39B – $1.65B | ▼ -8.9% |
| Plasma | $1.26B | $1.33B | $1.26B – $1.39B | ▲ +15.9% |
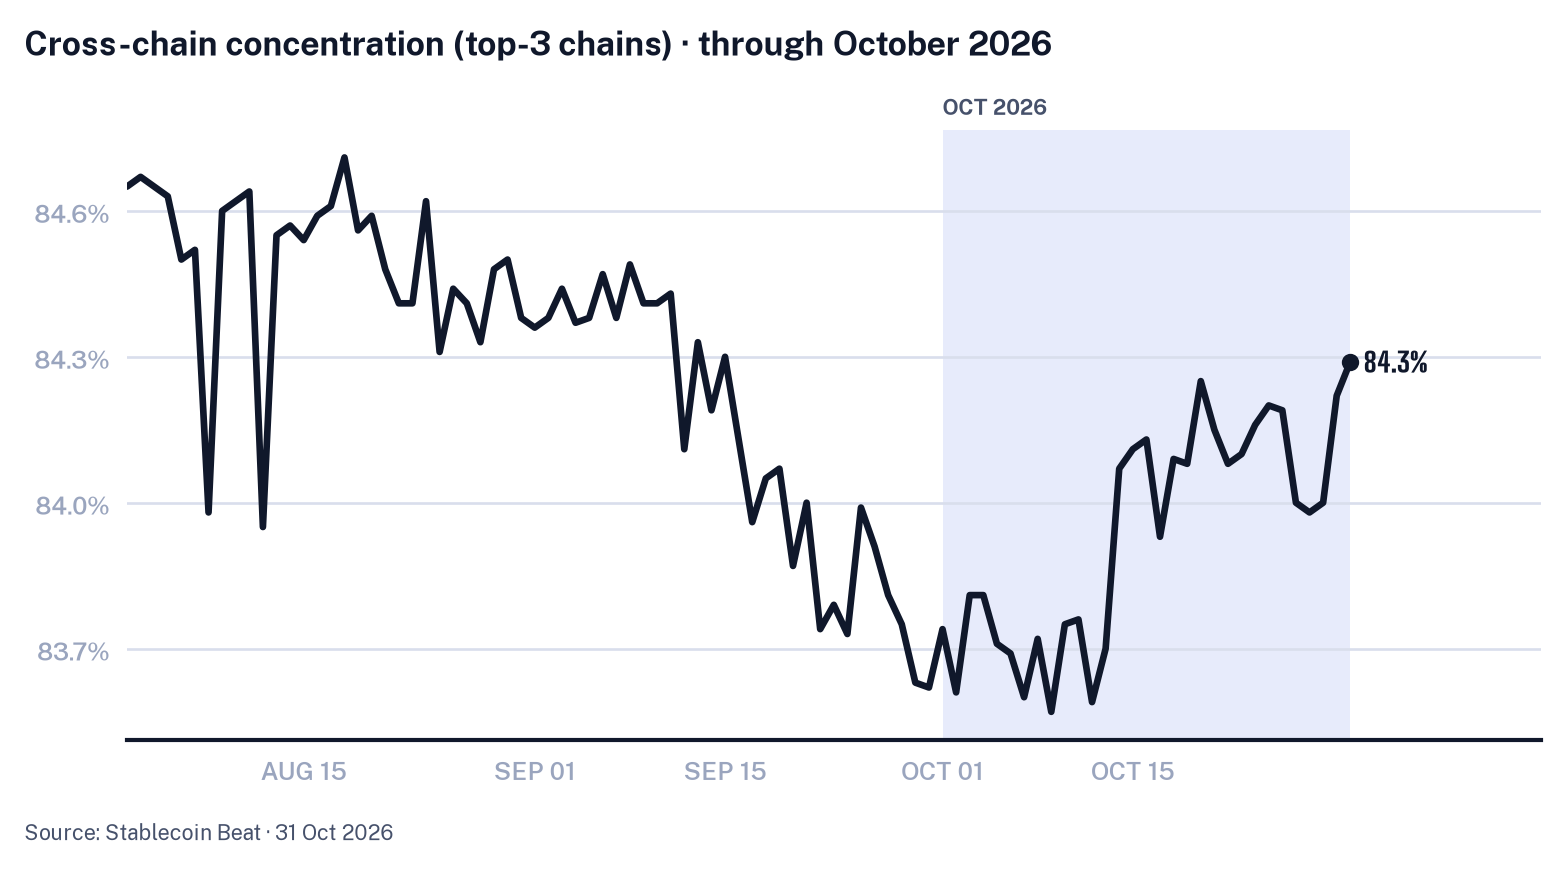
On 31 October 2026, circulating supply by chain totaled $295.58B and was concentrated on a few blockchains. Ethereum, the largest, held 47.5% of circulating supply by chain, while the top three chains together accounted for 84.3%.
The cross-chain entropy measure stood at 2.29 bits. In supply terms, the month-end distribution was defined by a large single-chain position and a top-three grouping that held most circulating supply by chain.
Yield-Bearing & Tokenized-Dollar Instruments
The yield-bearing and tokenized-dollar segment ended October 2026 at $13.80B, up $280M, or 2.1%, from the previous month, across 95 tracked instruments. The segment sat adjacent to Base Supply. Yield-bearing wrappers such as sUSDe and sUSDS were staked forms of underlying stablecoins already counted in Base Supply, so their value was a subset of that supply. Standalone tokenized-treasury tokens such as Ondo US Dollar Yield were money-market-like instruments outside the stablecoin universe.
sUSDS remained the largest listed yield-bearing instrument at $4.51B, after a $12M, 0.3% decline. Ondo US Dollar Yield rose $129M, or 5.7%, to $2.40B, while BFUSD was essentially unchanged at $1.32B, down $1M, or 0.0%. Ethena Staked USDe recorded the largest dollar decline among the listed instruments, falling $116M, or 9.0%, to $1.17B; syrupUSDC also contracted, down $79M, or 7.8%, to $930M.
Growth was concentrated in smaller listed instruments. Among the listed instruments, syrupUSDG posted both the largest dollar increase and the largest percentage increase, rising $142M, or 80.5%, to $318M. Re Protocol reUSD increased $76M, or 25.7%, to $372M, and syrupUSDT rose $48M, or 19.4%, to $298M.
Cross-Currents
Of the net -$8.87B change in Base Supply (S0), $4M reflected constituents that came into coverage during the month, across 2 smaller constituents. A further $568M reflected constituents that left coverage under the published constituent decisions, comprising Gate USD and 15 smaller constituents.
Among constituents present at both month-ends, the change was -$8.31B. The three largest contributors in that direction were USDT at -$4.19B, USDC at -$2.59B and USD1 at -$0.54B; together, they accounted for 88% of that -$8.31B change. The move was concentrated in a few products.
Coverage narrowed over the month, with Base Supply (S0) constituents moving from 162 to 148 as 2 came into coverage and 16 left it. Separately, the market HHI moved +1.06%.
The GENIUS-compliant cohort changed -3.2% over the month, against -2.78% for constituents of Base Supply (S0) present at both month-ends. The MiCA-compliant cohort changed -3.5%, also against -2.78% for the same like-for-like group. Both compliant cohorts fell more than the comparable continuing Base Supply (S0) constituents.
Peg stability weakened on both measures. Thirty-day depeg events rose from 11 to 25, while the average peg score fell from 96.6 to 94.0.
Macro & Crypto Backdrop
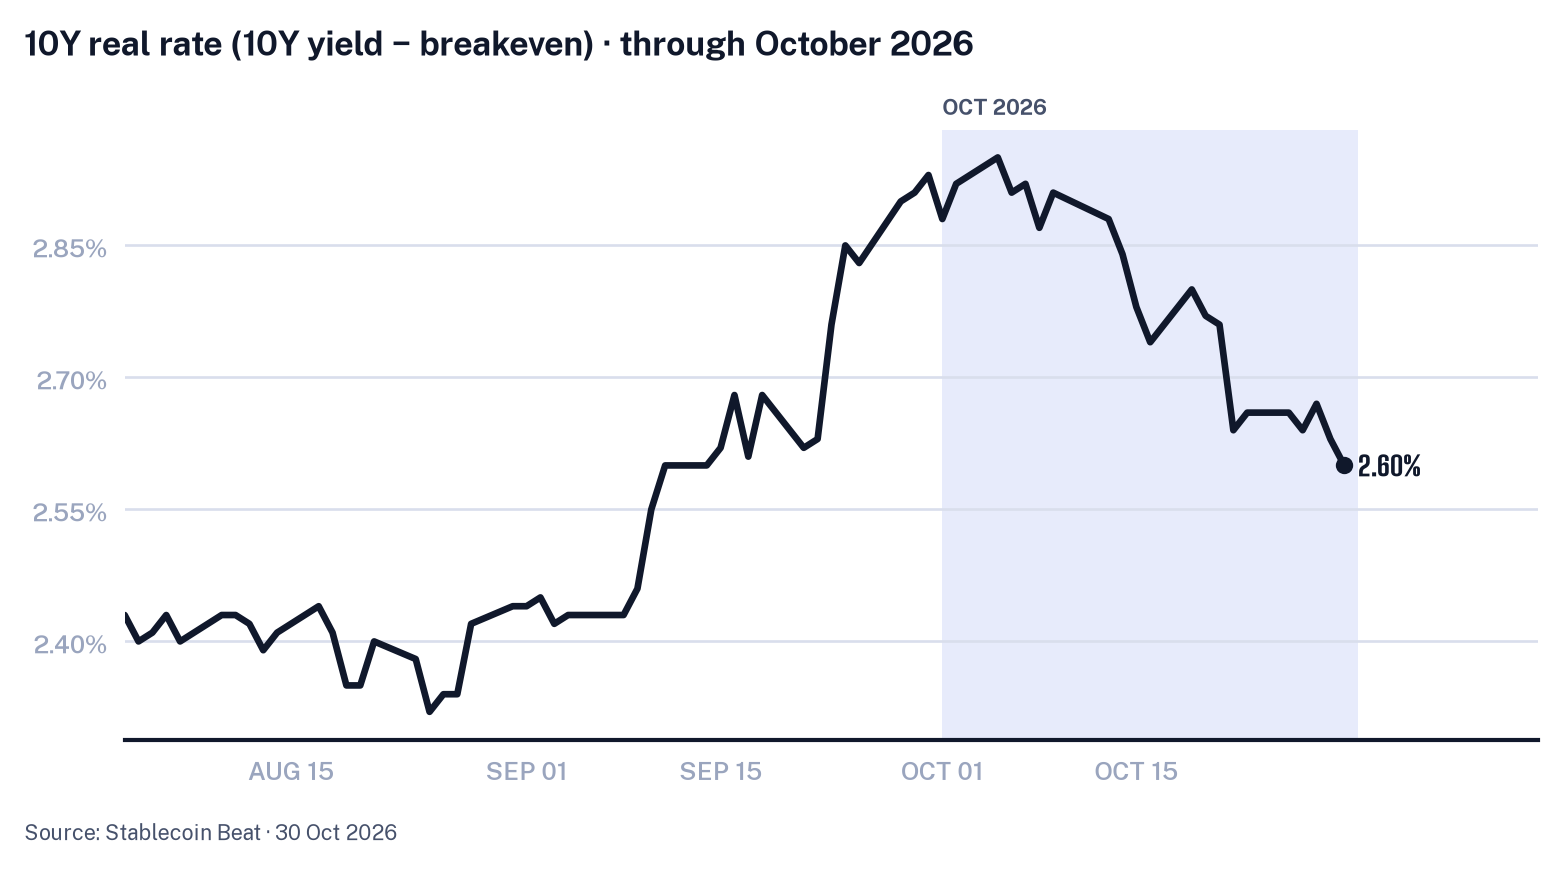
October ended with lower Treasury yields despite elevated intra-month levels. The US 10-year yield fell 35 bp, from 5.29% on 30 September 2026 to 4.94% on 30 October 2026, reversing September’s rise; the 10-year real rate fell 33 bp, from 2.93% to 2.60%, also reversing the prior month’s rise. The broad dollar index rose for a second consecutive month, from 121.0 to 121.7, a 0.58% increase, while the VIX rose for a second consecutive month, from 16.34 to 19.42, an 18.85% increase.
Crypto prices softened over the same period. Bitcoin fell 7.88%, from $83,882 on 30 September 2026 to $77,272 on 31 October 2026, reversing September’s rise. BTC dominance rose from 58.39% to 59.24%, a 0.85 percentage point increase that reversed the prior month’s decline. The Fear & Greed measure fell 41.0 points, from 71 to 30, also reversing September’s rise.
Rates still reached intra-month extremes. On 5 October 2026, the US 10-year yield reached its highest level since 14 May 2002, while the 10-year real rate reached its highest level since 24 November 2008; the US 10-year yield fully accounted for the real-rate move. During the month, the monthly averages for both the US 10-year yield and the 10-year real rate stood 2.7 times their typical variation above their trailing 12-month averages; for the real rate, the US 10-year yield accounted for 106% of the move, while 10-year breakeven inflation offset 6% in the opposite direction. On 22 October 2026, the US 10-year yield fell 17 bp on the day and the 10-year real rate fell 12 bp; in the real-rate step, the US 10-year yield accounted for 142% of the move, while 10-year breakeven inflation offset 42% in the opposite direction.
The macro context combined bond-market pressure, inflation headlines, policy-rate continuity, Russia sanctions and Ukraine diplomacy. A global bond sell-off at the start of the month, reports of UK long-term borrowing costs above 6%, and stronger-than-expected US inflation coincided with the elevated monthly rate averages. Later in the month, US interest rates were held steady. Russia-related sanctions exemptions, waivers and suspensions were reported across the month, with related Ukraine talks, while Gulf states worked on a multipart peace deal to avert a renewal of US-Iran war.