Base Supply (S0) rose for a second consecutive month, increasing from $295.64B on 31 August 2026, to $299.30B on 30 September 2026, a 1.24% gain. USDT’s share of Base Supply fell from 62.07% to 61.47%, while USDC’s share declined from 25.05% to 24.87%. Excluding constituents that
Size & Growth
- Base Supply (S0)
- $299.30B30 Sep 2026
- Net change
- +$3.7B+1.24% over month, incl. $1.65B into coverage
- Top gainer
- Ethena USDe+$795M, continuing constituents
Composition & Dominance
- USD-pegged
- 99.6%of Base Supply (S0)
- USDT share
- 61.5%of Base Supply (S0)
- Issuer HHI
- 4,428-82 MoM
Regulation & Stability
- GENIUS-compliant
- $77.38B26% of Base Supply (S0)
- MiCA-compliant
- $75.22B25% of Base Supply (S0)
- Avg peg score
- 96.6none off-peg on 30 Sep 2026
Contents
- News & Developments
- Analysis & Commentary
- Market Structure & Supply
- Concentration & Competition
- Regulatory Compliance (GENIUS & MiCA)
- Peg Currency & Dollarization
- Peg Stability & Risk
- Trading Activity & Turnover
- Network Distribution
- Yield-Bearing & Tokenized-Dollar Instruments
- Cross-Currents
- Macro & Crypto Backdrop
News & Developments
September’s stablecoin activity centered on regulation: the Federal Reserve unveiled rules on reserves and capital, while the ECB and EU central banks sought changes to MiCA’s minimum bank-deposit requirement for stablecoins. Institutional adoption also advanced through bank and card channels, as Citi clients gained access to stablecoin payments through Coinbase, and Visa tapped onchain lending to finance stablecoin card programs.
Regulation & Policy
Regulatory activity centered on reserve, deposit, and recognition frameworks, with the Federal Reserve’s reserve and capital rules sitting alongside the ECB and EU central banks’ proposed MiCA changes. Singapore weighed recognizing some foreign-issued stablecoins, Illinois draft crypto tax rules detailed DeFi and stablecoin treatment, and South Korea weighed crypto market makers after JPYC traded at 4 times its peg. Asset-control and enforcement-linked items also stayed in focus: Thai businessmen sued Tether over $42M in frozen tokens tied to a $61M pig-butchering case, Circle and Tether froze stablecoins tied to the Bitget hack, and Tether said it had limited exposure to a bank linked to an $84M US seizure.
Issuance & Launches
European stablecoin issuer AllUnity launched USDAU, a USD stablecoin.
Adoption & Partnerships
Bank and payments integrations led the adoption news: SoFi linked its banking network and stablecoin to Kraken in a deal with Kraken parent Payward that covered stablecoin and 24/7 settlement, while Citi clients gained access to stablecoin payments through Coinbase. In institutional credit and custody, Circle launched Bitcoin-backed USDC borrowing for institutional clients, Anchorage Digital added institutional access to Frgmnt’s fUSD stablecoin, and HIFI raised $37M to expand stablecoin payments and tokenized markets.
Analysis & Commentary
Beyond the data, the desk published the following analysis during September 2026.
Stablecoin Yield and the New Regulatory Boundary · 24 September 2026
Stablecoin regulation has largely focused on making sure issuers can meet redemptions and that the assets backing their tokens are safe. Regulators are now turning to a more complicated question: should stablecoin holders be able to earn a return on those balances?
Europe already restricts interest payments under MiCA and is considering how those rules should apply when stablecoins are used in lending, staking, and DeFi. The United States faces a similar debate. The GENIUS Act bars issuers from paying yield directly, while an effort to set boundaries around third-party rewards through the CLARITY Act stalled in the Senate.
The debate matters because yield changes how people use stablecoins. Once they can generate a return, they begin competing more directly with bank deposits and other savings products. That raises broader questions about bank funding, the investment of stablecoin reserves, and who ultimately receives the income those reserves generate. Full analysis: stablecoinbeat.com/insights/stablecoin-yield-new-regulatory-boundary/
Market Structure & Supply
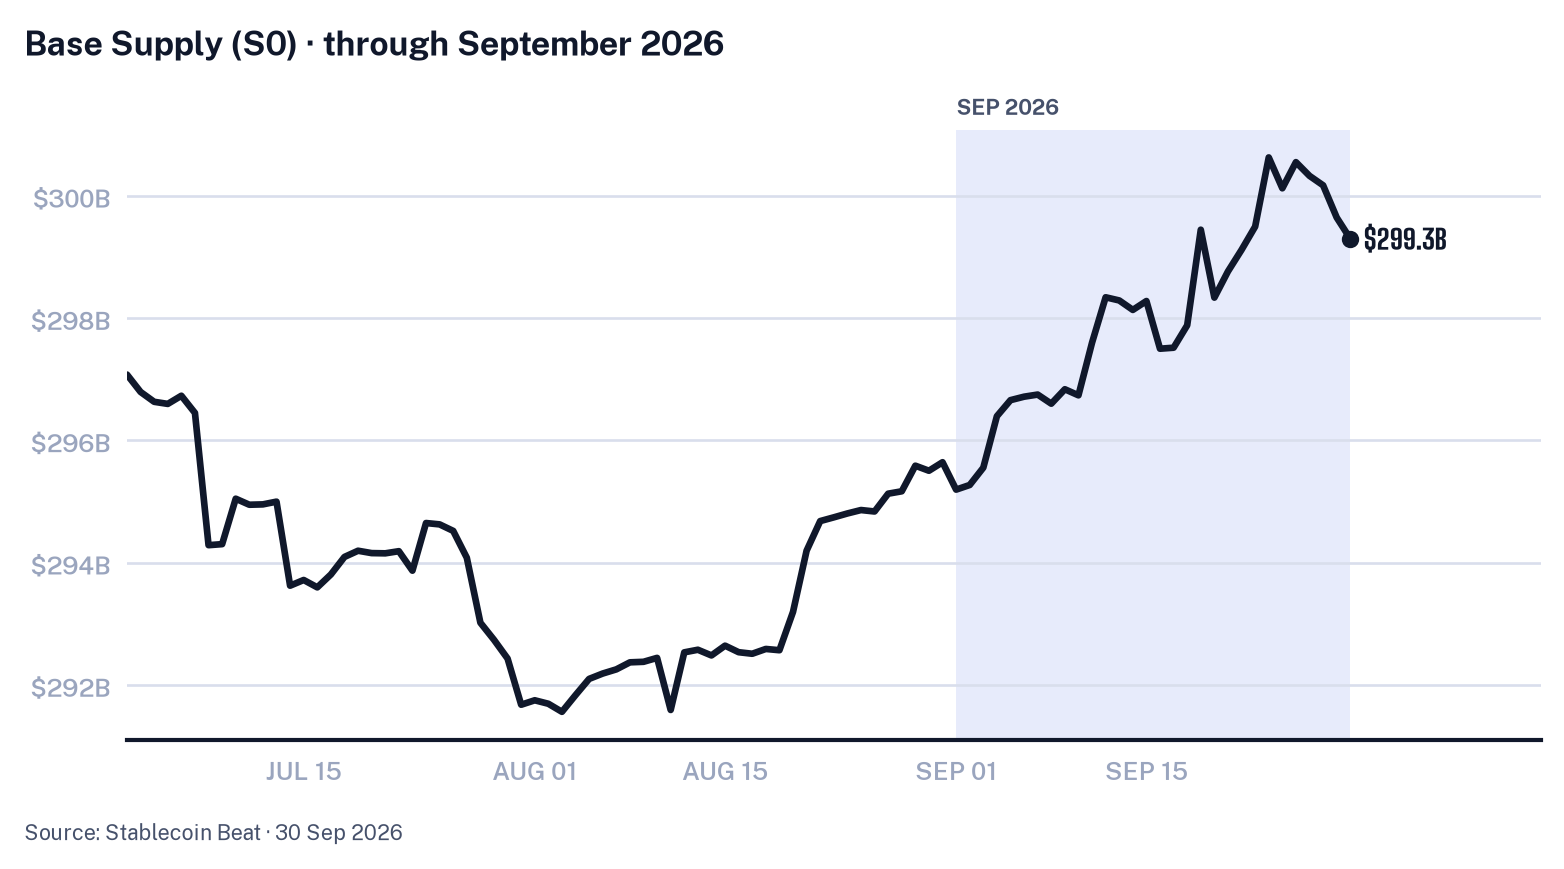
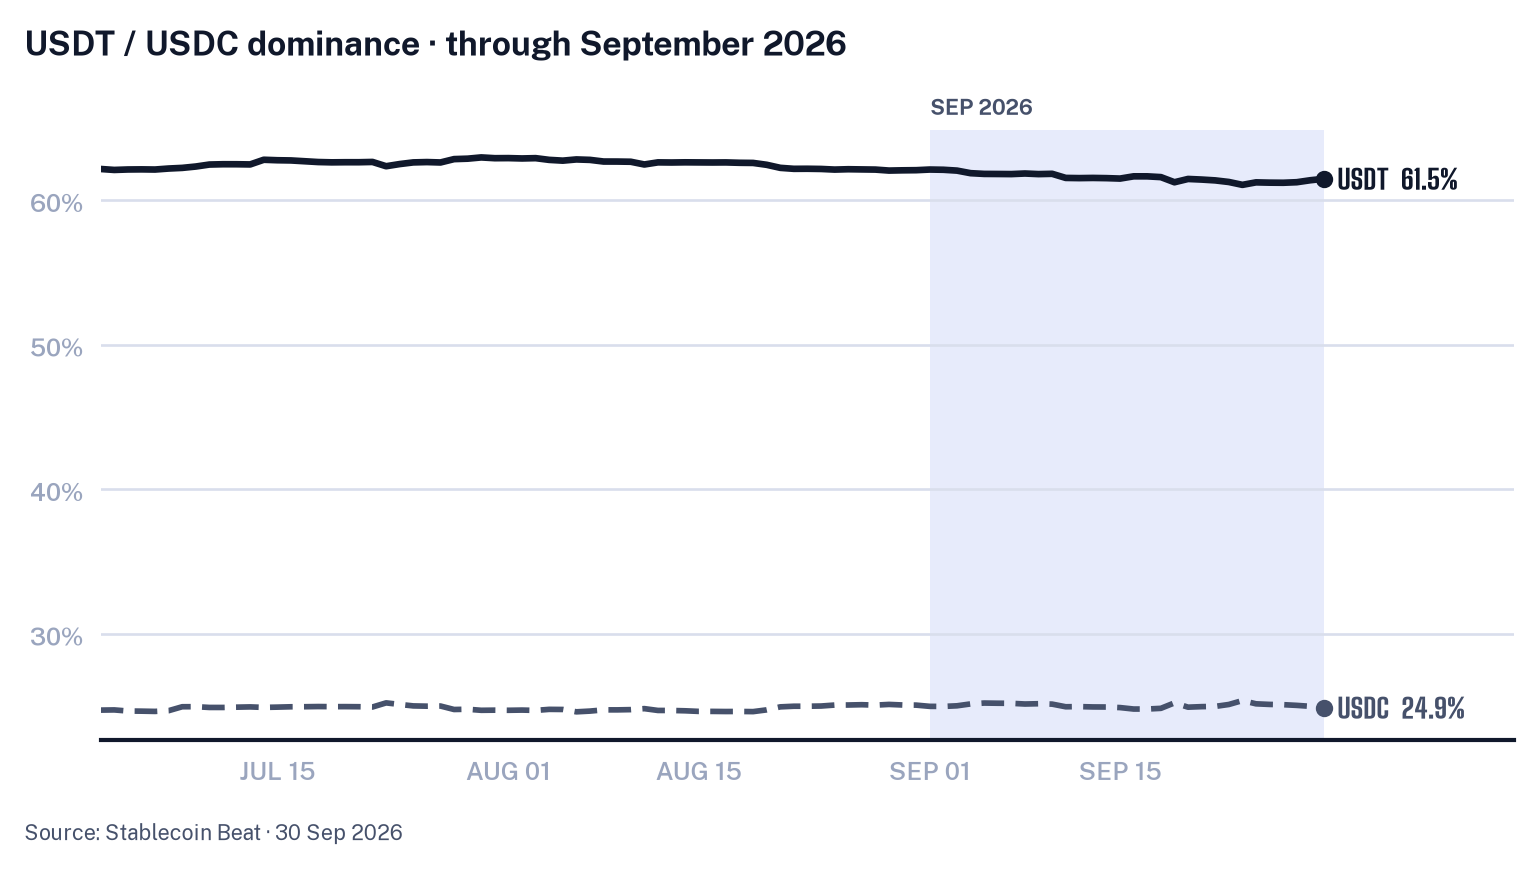
Base Supply (S0) rose for a second consecutive month, increasing from $295.64B on 31 August 2026, to $299.30B on 30 September 2026, a 1.24% gain. USDT’s share of Base Supply fell from 62.07% to 61.47%, while USDC’s share declined from 25.05% to 24.87%. Excluding constituents that came into coverage during the month, USDT’s share moved from 62.07% to 61.81% and USDC’s from 25.05% to 25.01%; the remainder of the headline share declines reflected dilution from coverage additions.
USDD came into coverage of Base Supply on 11 September 2026, and stood at $1.52B at month-end. The movement reflected USDD being added to coverage under the specification. Within constituents above $1B that were ranked by percentage change, Ethena USDe rose 19.5%, adding $795M to reach $4.88B; United Stables rose 17.3%, adding $220M to reach $1.50B; Ripple USD rose 6.3%, adding $149M to reach $2.52B; and USD1 rose 5.6%, adding $235M to reach $4.43B. Among decliners, USDGO fell 5.0% and subtracted $63M to reach $1.19B, followed by Global Dollar, down 4.8% and $157M to $3.10B, and PayPal USD, down 2.2% and $61M to $2.72B. USDS rose 0.5%, adding $35M to reach $6.70B.
The month also showed above-trend readings in selected supply and distribution measures. Ripple USD supply averaged above its trailing 12-month average by 3.2 times its typical variation. United Stables supply and cross-chain Shannon entropy each averaged above their trailing 12-month averages by 2.1 times their typical variation.
Concentration & Competition
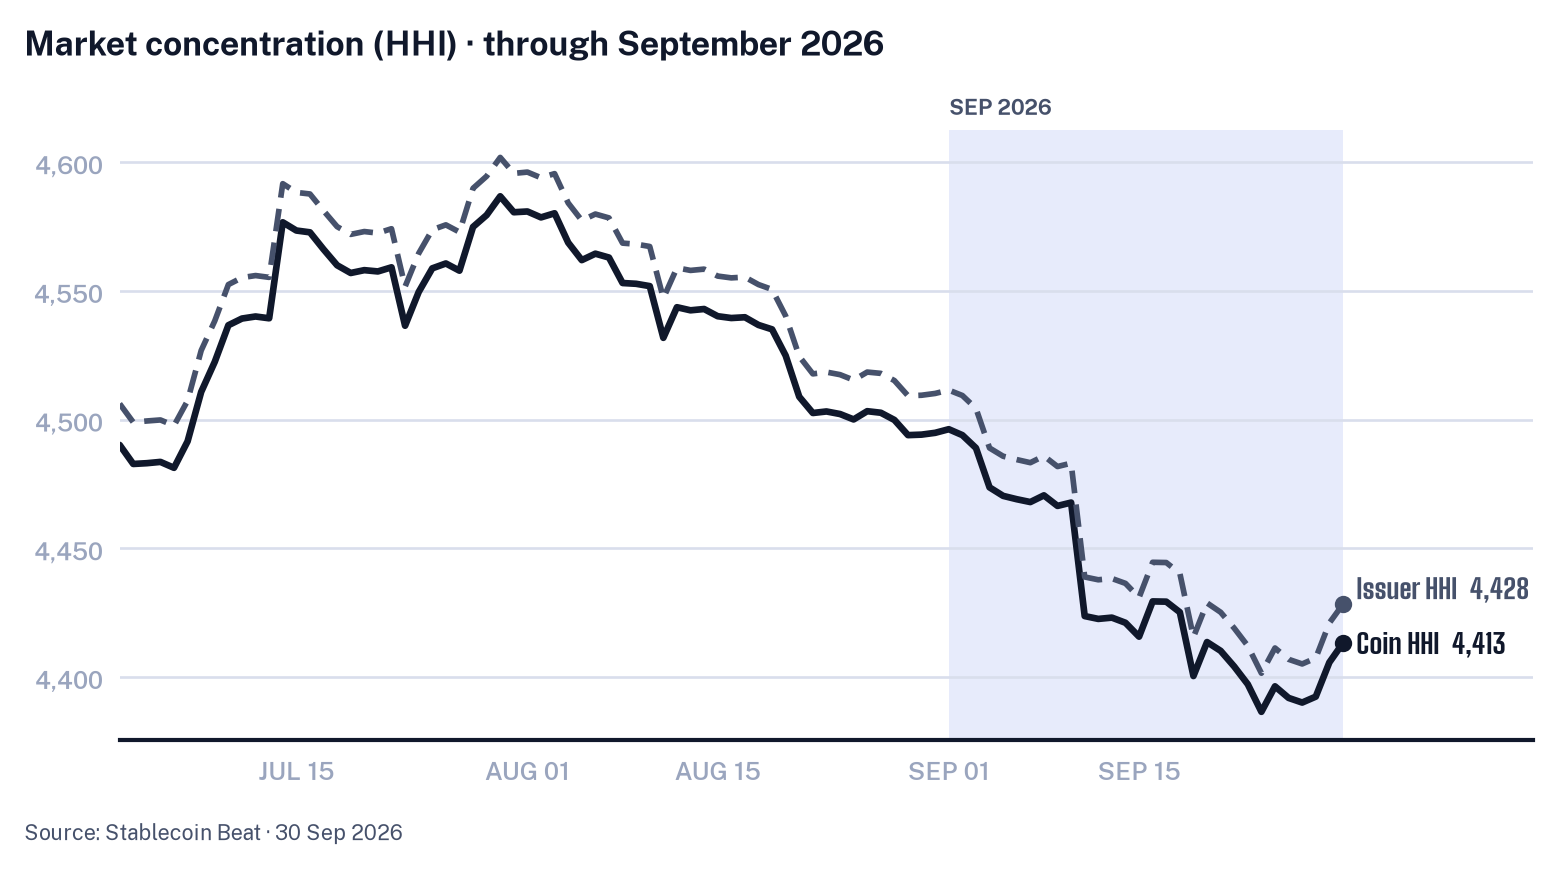
Concentration eased in September. The market HHI fell from 4,495 on 31 August 2026 to 4,413 on 30 September 2026, a 1.82% decline and a second consecutive monthly fall. The issuer HHI moved in parallel, declining from 4,510 to 4,428, also down 1.82% for a second consecutive month. The issuer Theil index edged lower from 3.71 to 3.70, a 0.32% decline, extending the prior month’s fall.
On a same-constituent basis, the market HHI declined from 4,495 on 31 August 2026 to 4,462 on 30 September 2026. The remainder of the monthly HHI decline reflected dilution from constituents that came into coverage during the month.
The month’s main HHI move occurred on 11 September 2026, when issuer HHI fell 0.99% day over day, a move 4.5 times its typical variation. TRON DAO and FUSD coming into coverage accounted for 103% of the move; Tether offset 9% in the opposite direction, while Circle accounted for 6%. Coin-level market HHI also fell 0.99% that day. USDD and FUSD coming into coverage accounted for 103% of the coin-level move, while USDT offset 9% in the opposite direction and USDC accounted for 6%.
Regulatory Compliance (GENIUS & MiCA)
| Coin | 31 Aug 2026 | 30 Sep 2026 | Change |
|---|---|---|---|
| USDC | $74.07B | $74.44B | +0.5% |
| PayPal USD | $2.78B | $2.72B | -2.2% |
| USAT | $184M | $183M | -0.5% |
| Pax Dollar | $29M | $26M | -10.6% |
| Coin | 31 Aug 2026 | 30 Sep 2026 | Change |
|---|---|---|---|
| USDC | $74.07B | $74.44B | +0.5% |
| EURC | $456M | $466M | +2.0% |
| EUR CoinVertible | $178M | $186M | +4.2% |
| Eurite | $38M | $38M | -2.1% |
| Monerium EUR emoney | $33M | $34M | +3.7% |
At month-end, GENIUS Act-compliant supply stood at $77.38B, equivalent to 25.9% of Base Supply, after rising 0.4% since 31 August 2026. MiCA-compliant supply stood at $75.22B, or 25.1% of Base Supply, after a 0.5% increase over the same period.
The two category totals overlapped and should be read separately, because both cohorts consisted mostly of USDC. USDT, the largest constituent, was absent from both published cohorts. The classifications were published categories and carried no legal determination.
Peg Currency & Dollarization
| Currency | End of month | % of S0 | Avg (month) | vs prev month |
|---|---|---|---|---|
| USD | $298.21B | 99.64% | $296.98B | ▲ +1.6% |
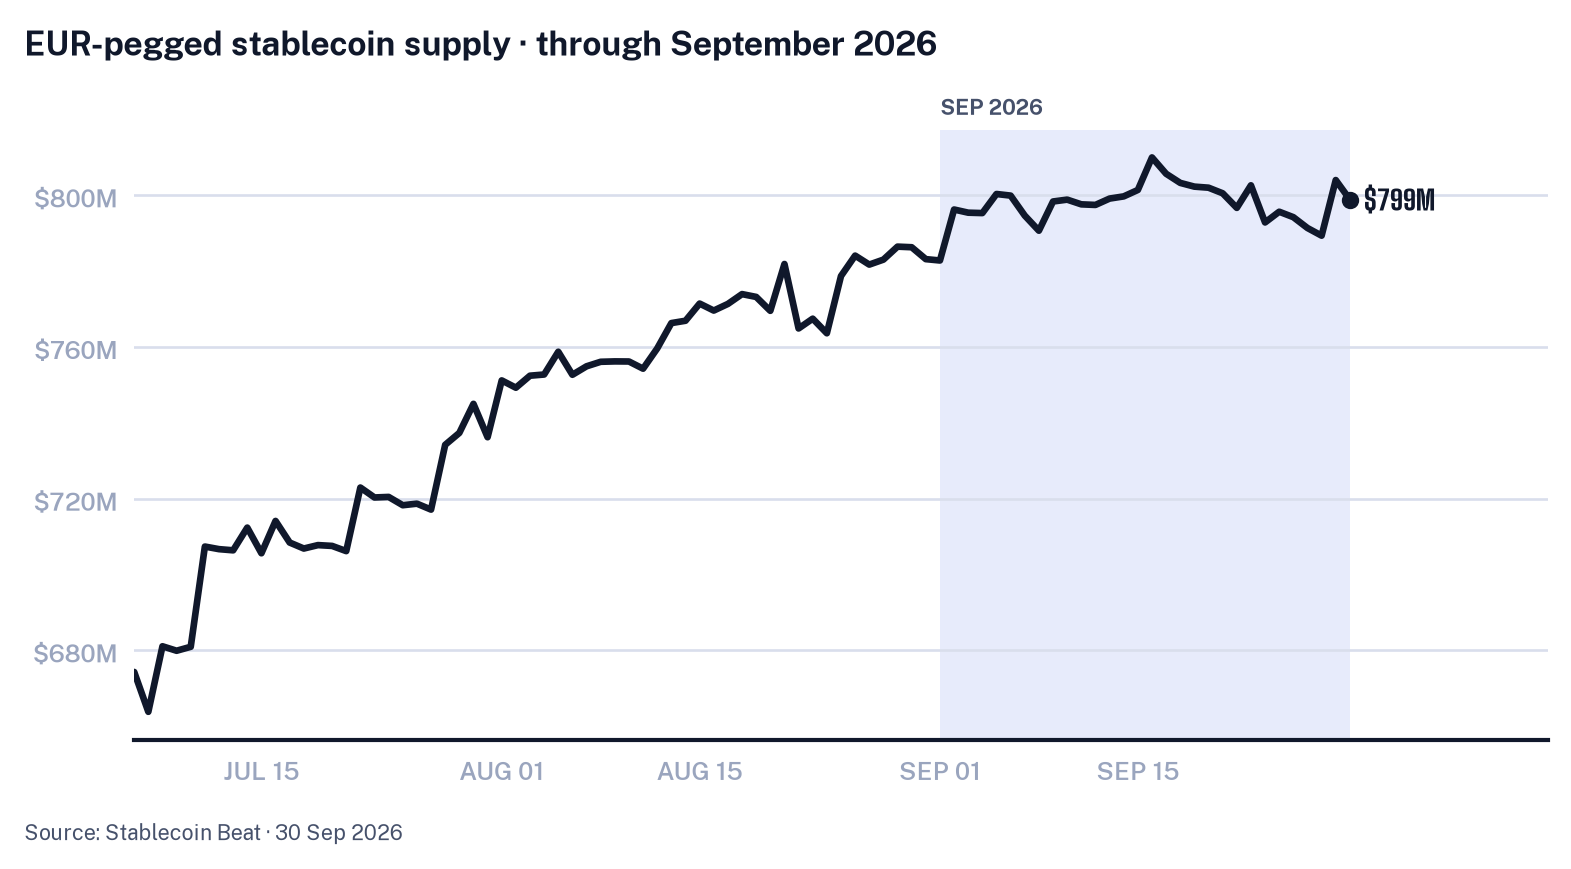
| EUR | $799M | 0.27% | $798M | ▲ +4.0% |
| JPY | $152M | 0.05% | $147M | ▲ +1.9% |
| CHF | $44M | 0.01% | $45M | → -0.3% |
| GBP | $27M | 0.01% | $27M | ▼ -7.9% |
| BRL | $22M | 0.01% | $28M | ▼ -12.5% |
| AUD | $14M | 0.00% | $15M | ▼ -8.8% |
| SGD | $13M | 0.00% | $13M | ▲ +4.7% |
At the end of September 2026, USD-pegged stablecoins accounted for 99.64% of Base Supply, making the market overwhelmingly dollar-denominated. The largest non-USD peg was the euro, with EUR-pegged supply at $799M.
The non-USD segment remained a narrow long tail. Most euro supply was in MiCA-compliant coins, while other currency pegs, including GBP, CHF and JPY, were small.
Peg Stability & Risk
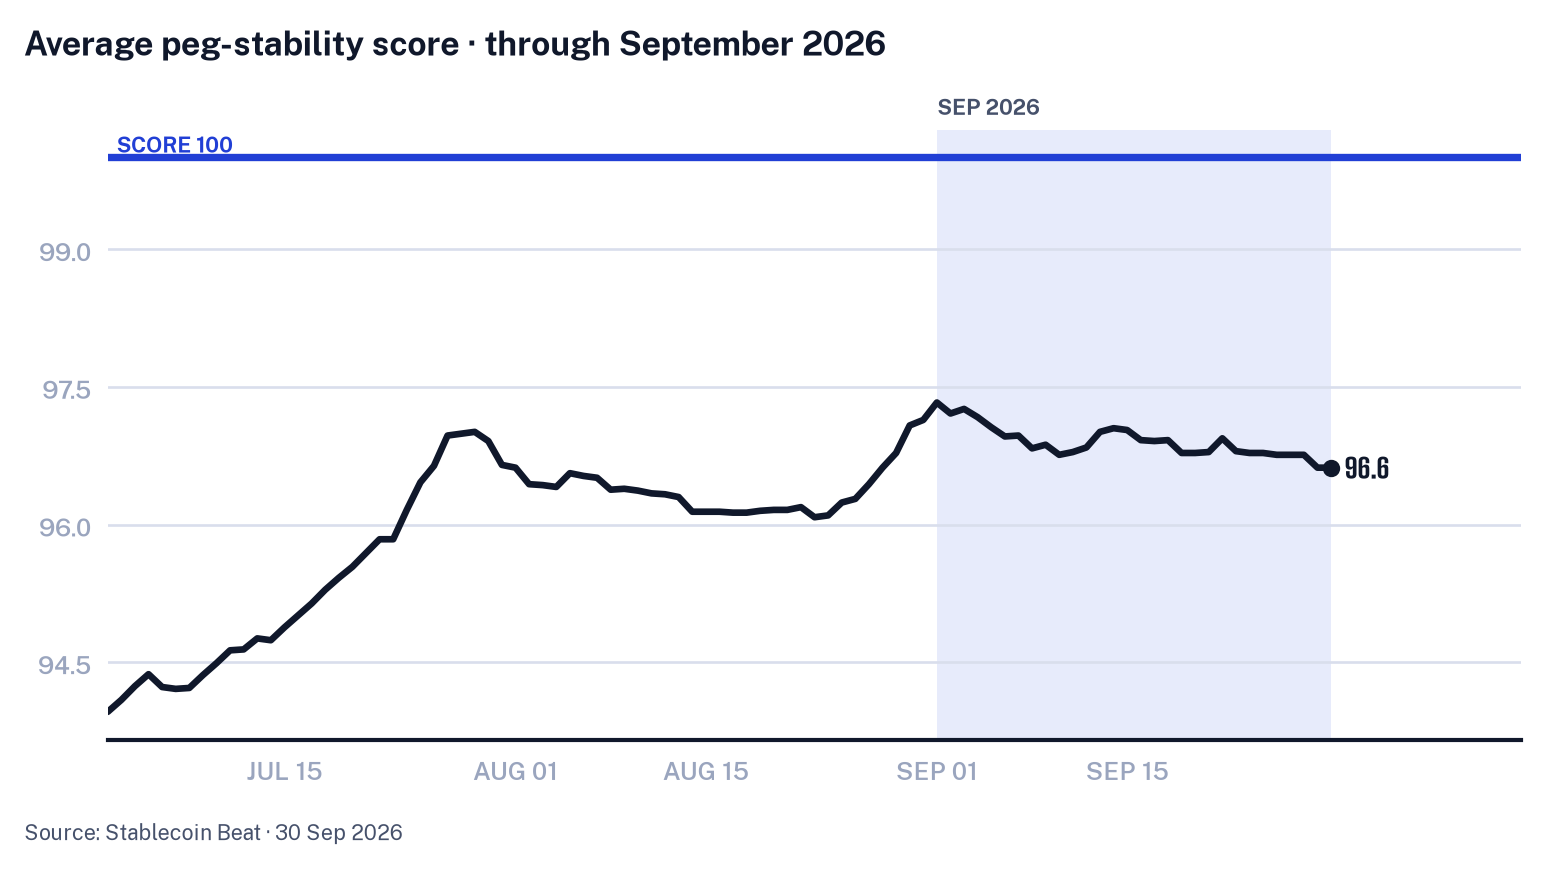
The average peg score, a 0-100 stability score in which 100 meant a coin held $1.00 all month and lower values captured drift and off-peg days, slipped from 97.1 on 31 August 2026 to 96.6 on 30 September 2026, reversing the prior month’s rise. The measure covered dollar-pegged coins; euro- and other-currency stablecoins sat outside it because they required an FX reference. No coin was off-peg at either month-end, with the count at 0 on both 31 August 2026 and 30 September 2026, although days with at least one coin off-peg recurred through the month, totaling 11 of 30. The worst deviation was little changed, moving from 0.416% to 0.419% and reversing the prior month’s decline, while 30-day depeg events rose from 4 to 11, also reversing the prior month’s decline.
The month’s off-peg activity was intermittent, while the end-month snapshots showed no coins off-peg. Coins off-peg registered 1 on 11 days, consistent with the 11 of 30 days that had at least one coin off-peg. Deviation pressure peaked on 5 September 2026, when the maximum depeg deviation exceeded 0.50% and reached 1.22%. By 29 September 2026, 30-day depeg events stood at 11, a level recorded on 2 days.
Trading Activity & Turnover
| Coin | Base Supply (S0) | 24h volume | Turnover |
|---|---|---|---|
| USDT | $183.98B | $65.15B | 35% |
| Global Dollar | $3.10B | $913M | 29% |
| USDC | $74.44B | $18.05B | 24% |
| USD1 | $4.43B | $918M | 21% |
| United Stables | $1.50B | $139M | 9% |
| Ripple USD | $2.52B | $234M | 9% |
| Dai | $4.78B | $127M | 3% |
| PayPal USD | $2.72B | $72M | 3% |
Trading activity stood at 29.3% of Base Supply value on 30 September 2026, for the 17 constituents whose traded-volume series matched unambiguously. Those constituents together represented 98.0% of Base Supply.
Network Distribution
| Network | End of month | Avg (month) | Range (min – max) | vs prev month |
|---|---|---|---|---|
| Ethereum | $145.83B | $146.67B | $145.81B – $147.43B | → -0.2% |
| Tron | $94.01B | $93.88B | $93.17B – $94.18B | ▲ +2.0% |
| Solana | $16.32B | $16.01B | $15.18B – $16.57B | ▲ +2.2% |
| BSC | $13.82B | $13.55B | $13.29B – $13.90B | ▼ -2.6% |
| Hyperliquid L1 | $7.45B | $7.19B | $6.79B – $7.85B | ▲ +11.7% |
| Base | $5.06B | $4.97B | $4.87B – $5.11B | ▲ +2.1% |
| Arbitrum | $3.85B | $3.68B | $3.47B – $3.85B | ▲ +3.2% |
| Polygon | $2.92B | $3.01B | $2.90B – $3.14B | ▼ -2.5% |
| X Layer | $1.58B | $1.68B | $1.58B – $1.87B | ▼ -17.5% |
| Avalanche | $1.46B | $1.43B | $1.33B – $1.47B | ▼ -6.3% |
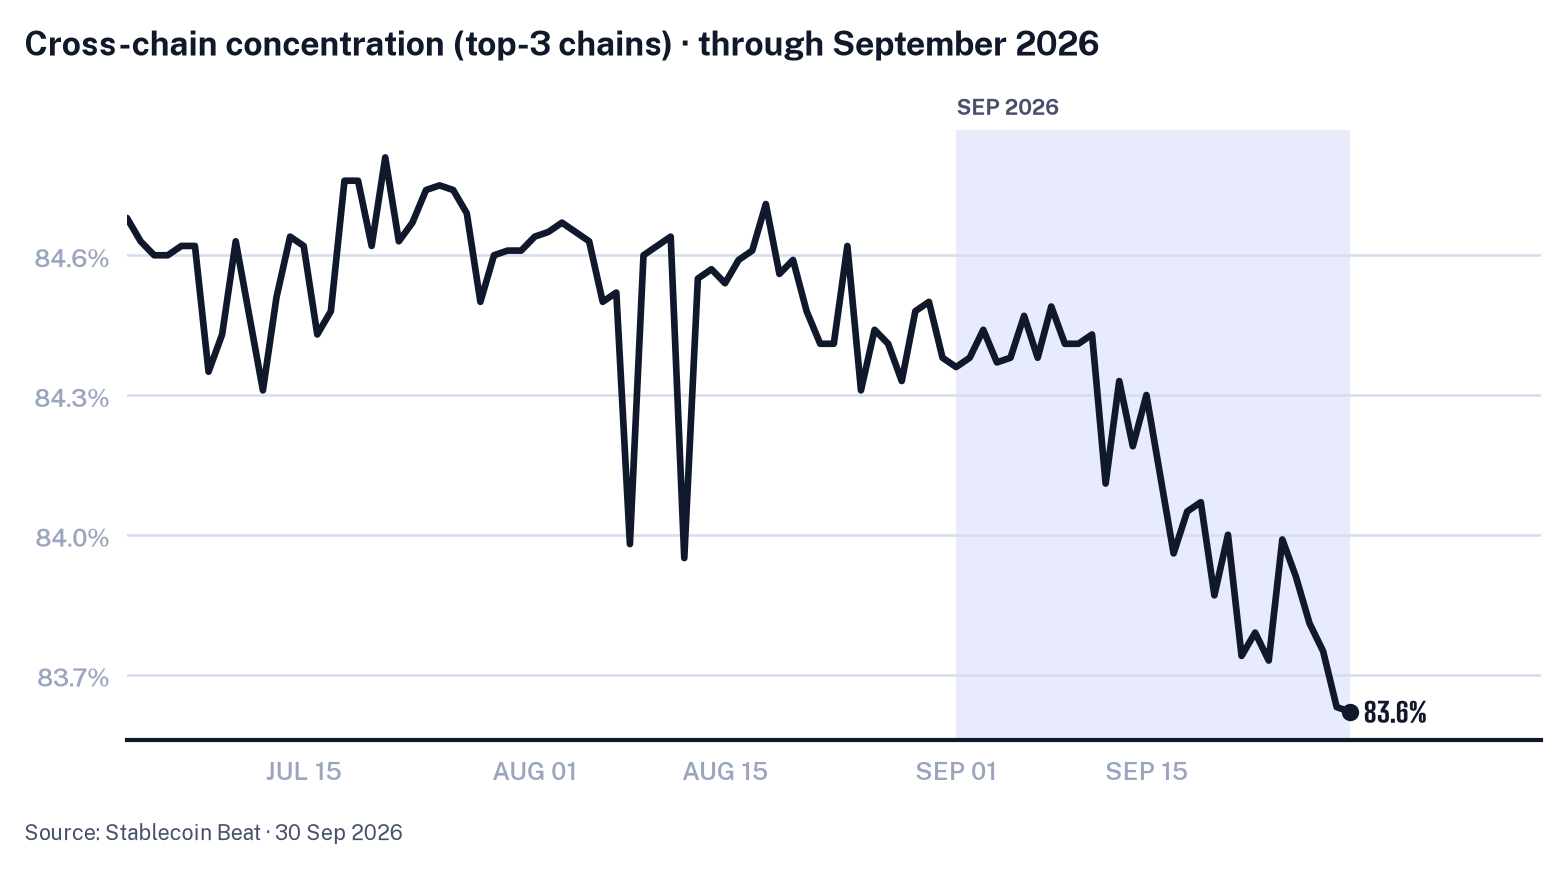
Stablecoin circulating supply by chain totaled $306.32B on 30 September 2026. The distribution was concentrated across blockchains: the three largest chains held 83.6% of circulating supply by chain, while the largest single chain held 47.6%.
Cross-chain entropy stood at 2.33 bits, indicating that supply was spread beyond the leading chain and remained heavily weighted toward the largest venues.
Yield-Bearing & Tokenized-Dollar Instruments
The yield-bearing and tokenized-dollar segment stood at $13.52B at the end of September 2026, down $261M, or 1.9% month on month, across 93 tracked instruments. The segment remained adjacent to Base Supply (S0): yield-bearing wrappers such as sUSDe and sUSDS were staked forms of underlying stablecoins, USDe and USDS, already counted in Base Supply, so their value represented a subset of that supply. Standalone tokenized-treasury tokens, including Ondo US Dollar Yield, were money-market-like instruments outside the stablecoin universe.
Among the largest instruments, sUSDS ended the month at $4.52B after a $178M decline, a 3.8% fall versus the previous month-end and the largest dollar decrease in the group. Ondo US Dollar Yield rose $89M, or 4.1%, to $2.27B, the largest dollar increase. BFUSD was essentially flat at $1.32B, down $1M, or 0.1%, while Ethena Staked USDe fell $49M, or 3.7%, to $1.29B. syrupUSDC rose $38M, or 3.9%, to $1.01B.
Smaller instruments showed wider percentage moves. Re Protocol reUSD increased $59M, or 25.1%, to $296M, the largest percentage gain among the listed instruments. syrupUSDT fell $152M, or 37.8%, to $250M, the largest percentage decline, while USDai rose $17M, or 7.7%, to $245M.
Cross-Currents
In September 2026, Base Supply (S0) rose by a net $3.65B, of which $1.65B reflected constituents that came into coverage during the month. USDD accounted for $1.52B of that coverage movement, with 5 smaller constituents making up the balance. This was a change in coverage.
Among constituents present at both month-ends, Base Supply (S0) increased by $2.00B. The move was concentrated in a few products: Ethena USDe added $0.79B, USDT $0.48B, and USDC $0.38B, together accounting for 83% of the like-for-like increase.
Coverage broadened as the number of Base Supply (S0) constituents rose from 156 to 162, a 4% increase, while the market HHI fell 1.82%. The combination paired a higher constituent count with lower measured concentration.
The GENIUS-compliant cohort grew 0.4% over the month, less than the 0.68% like-for-like increase among Base Supply (S0) constituents present at both month-ends. The MiCA-compliant cohort rose 0.5%, also less than the same like-for-like Base Supply (S0) change.
Peg stability weakened on frequency and on the average score. Thirty-day depeg events rose from 4 to 11, while the average peg score declined from 97.1 to 96.6.
Macro & Crypto Backdrop
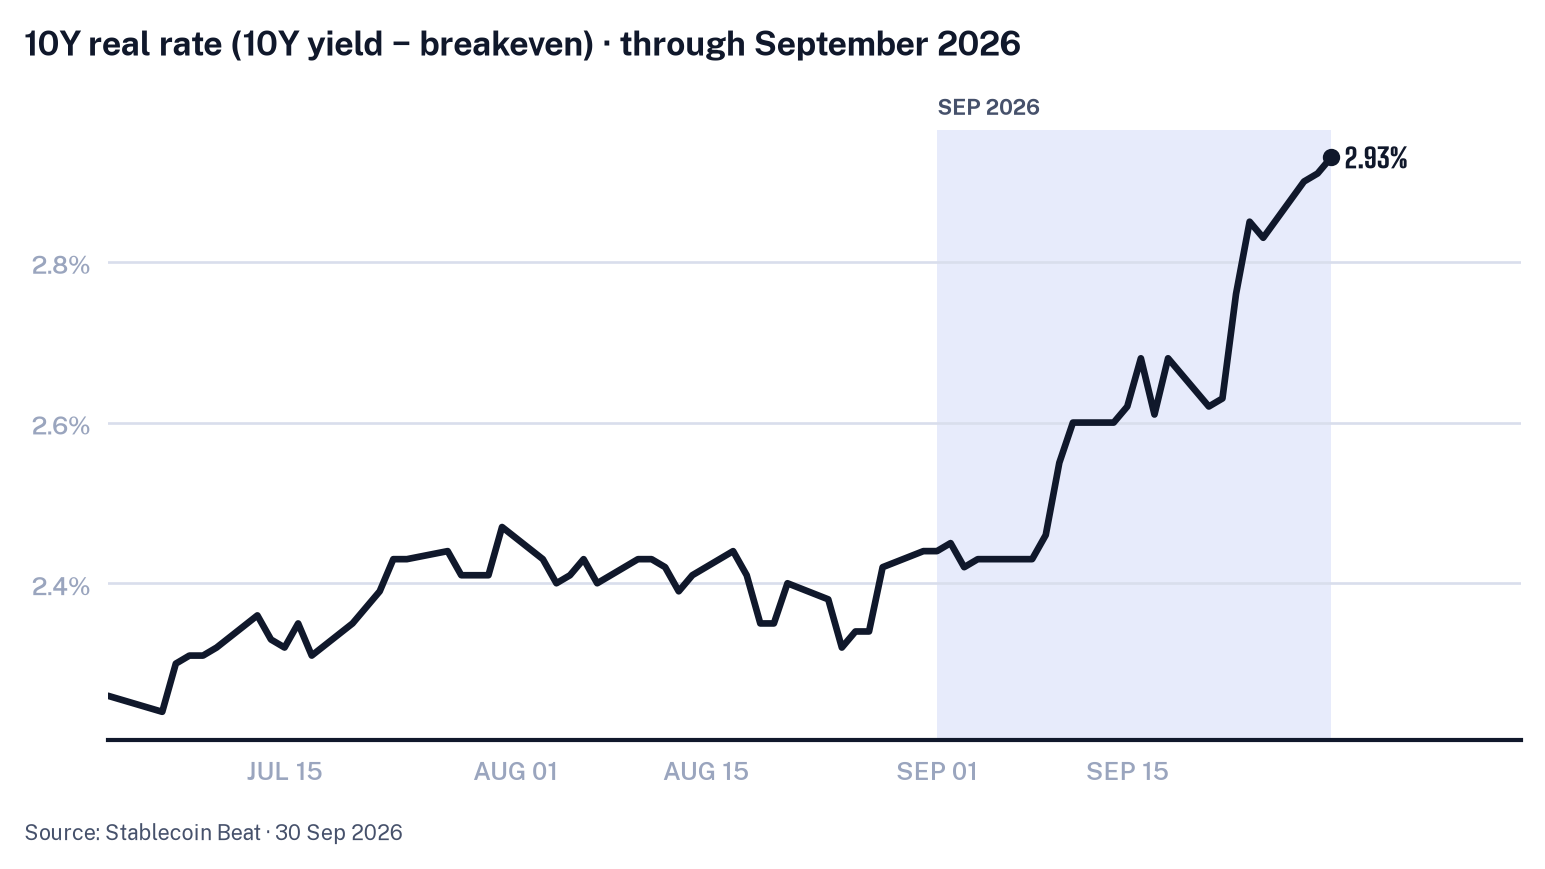
At month-end, yields were higher. The US 10-year yield rose from 4.75% on 31 August 2026 to 5.29% on 30 September 2026, a 54 bp increase. The 10-year real rate rose from 2.44% to 2.93%, a 49 bp move that reversed the prior month’s decline. The broad dollar index increased from 118.6 on 31 August 2026 to 120.3 on 25 September 2026, its latest observation in the month, rising 1.49% and reversing August’s decline. The VIX rose from 14.92 to 16.34, a 9.52% increase in expected volatility that also reversed the prior month’s decline.
Crypto measures firmed in price and sentiment, while concentration eased. Bitcoin rose from $78,418 on 31 August 2026 to $83,882 on 30 September 2026, a 6.97% gain and its third consecutive monthly increase. Fear & Greed rose from 62 to 71, up 9.0 points and also higher for a third consecutive month. BTC dominance fell from 59.19% to 58.39%, a 0.80 percentage point decline that reversed August’s rise.
The rate move was large against the series’ recent variation. The 54 bp monthly increase in the US 10-year yield was 3.2 times its typical variation, and the monthly average was above its trailing 12-month average. On 30 September 2026, the US 10-year yield reached its highest level since 14 May 2002. The 10-year real rate reached its highest level since 24 November 2008; the US 10-year yield accounted for 110% of the real-rate move, while 10-year breakeven inflation offset 10% in the opposite direction. The SOFR overnight rate recorded a 23 bp step on 17 September 2026, coinciding with the reported interest-rate increase that day, and held through month-end as a level shift.
The dollar’s strengthening was concentrated in the second half of the month: the broad dollar index’s second-half mean was 1.4% above its first-half mean. Macro headlines centered on surging inflation, global bond-market instability, oil-linked inflation concerns, US-Iran tensions, Russia sanctions and financial-stability commentary. Those threads accompanied higher nominal and real yields, a stronger dollar and higher expected volatility over the month.