Total stablecoin supply began August at $297.85B and ended at $303.95B, a 2.05% increase that reversed the July 2026 decline. Market share shifted modestly: USDT dominance fell from 61.5% to 60.7%, down 0.7 percentage point, while USDC dominance rose from 24.1% to 24.4%, up 0.3 p
Size & Growth
- Total supply
- $303.95B31 Aug 2026
- Net change
- +$6.1B+2.05% over month
- Top gainer
- USDC+$1.8B over month
Composition & Dominance
- USD-pegged
- 99.1%of supply
- Tether share
- 60.7%of supply
- Issuer HHI
- 4,267-145 MoM
Regulation & Stability
- GENIUS-compliant
- $73.94B25% of supply
- MiCA-compliant
- $74.45B26% of supply
- Avg peg score
- 97.1none off-peg
Contents
- News & Developments
- Analysis & Commentary
- Market Structure & Supply
- Concentration & Competition
- Regulatory Compliance (GENIUS & MiCA)
- Peg Currency & Dollarisation
- Backing & Collateral Types
- Peg Stability & Risk
- Trading Activity & Turnover
- Network Distribution
- Yield-Bearing & Tokenized-Dollar Instruments
- Cross-Currents
- Macro & Crypto Backdrop
News & Developments
August stablecoin developments centered on US implementation of the GENIUS Act, with the Treasury and banking regulators moving ahead on rulemaking, while FASB proposed conditions for treating stablecoins as cash equivalents. Payment-network activity included Visa, Mastercard, and Western Union stablecoin transfer, payout, and settlement initiatives, including two Korean partnerships.
Regulation & Policy
Regulatory attention centered on US rulemaking, where the Treasury moved forward with GENIUS Act rules after a July deadline, and a banking regulator was reported to be working to finalize stablecoin rules under the same law. In a related accounting step, FASB proposed conditions for stablecoins to qualify as cash equivalents. Outside the US, the US and UK reaffirmed support for stablecoins and tokenization in joint financial regulation talks, Russia proposed exchange trading of Bitcoin, Ether, and Tether’s USDT, South Africa planned exchange controls for offshore crypto and stablecoin flows, the Bank of England was set for a new innovation mandate covering stablecoins, and Japan’s regulator requested a tax filing exemption for trust-type stablecoins in its 2027 reform process.
Issuance & Launches
Issuance activity was selective but institutionally relevant: Anchorpoint, a Standard Chartered-linked venture, launched a beta version of the HKDAP stablecoin, while Tether claimed the “largest inaugural financial audit” after KPMG signed off on its 2025 statements.
Adoption & Partnerships
Large payment networks led adoption news, with Mastercard and Borderless testing shared identity checks for stablecoin transfers, Western Union bringing stablecoin remittances to the Visa network through Stablecard, and Visa widening stablecoin payouts via Zerohash rails. Visa also joined BLOOM for stablecoin settlement as Shinhan adopted the Visa Stablecoin Platform, then signed a second Korean stablecoin deal in the same week with Hana-backed Dunamu. Beyond card-network activity, FalconX and Ethena brought USDe backing assets into a $1B institutional credit facility, while Russia’s Sberbank said it planned Ethereum and USDT-backed loans and separately questioned digital ruble demand.
Other developments
Tether earned $1.5B in Q2 as US Treasury holdings fueled profits.
Analysis & Commentary
Beyond the data, the desk published the following analysis during August 2026.
Stablecoins and the Treasury Twist · 31 August 2026
The U.S. Treasury's decision in August to increase purchases of long-dated government bonds was small in dollar terms. The policy implications are harder to dismiss. Treasury is becoming more active at the long end of the government bond market just as another major policy shift is creating a potentially large and structurally different class of buyers at the opposite end of the curve: regulated stablecoin issuers. This is not yield curve control, and there is no evidence of coordination. But the structure of U.S. public debt increasingly matters for stablecoins, and the structure of stablecoins may increasingly matter for U.S. public debt. Full analysis: stablecoinbeat.com/insights/stablecoins-and-the-treasury-twist/
Market Structure & Supply
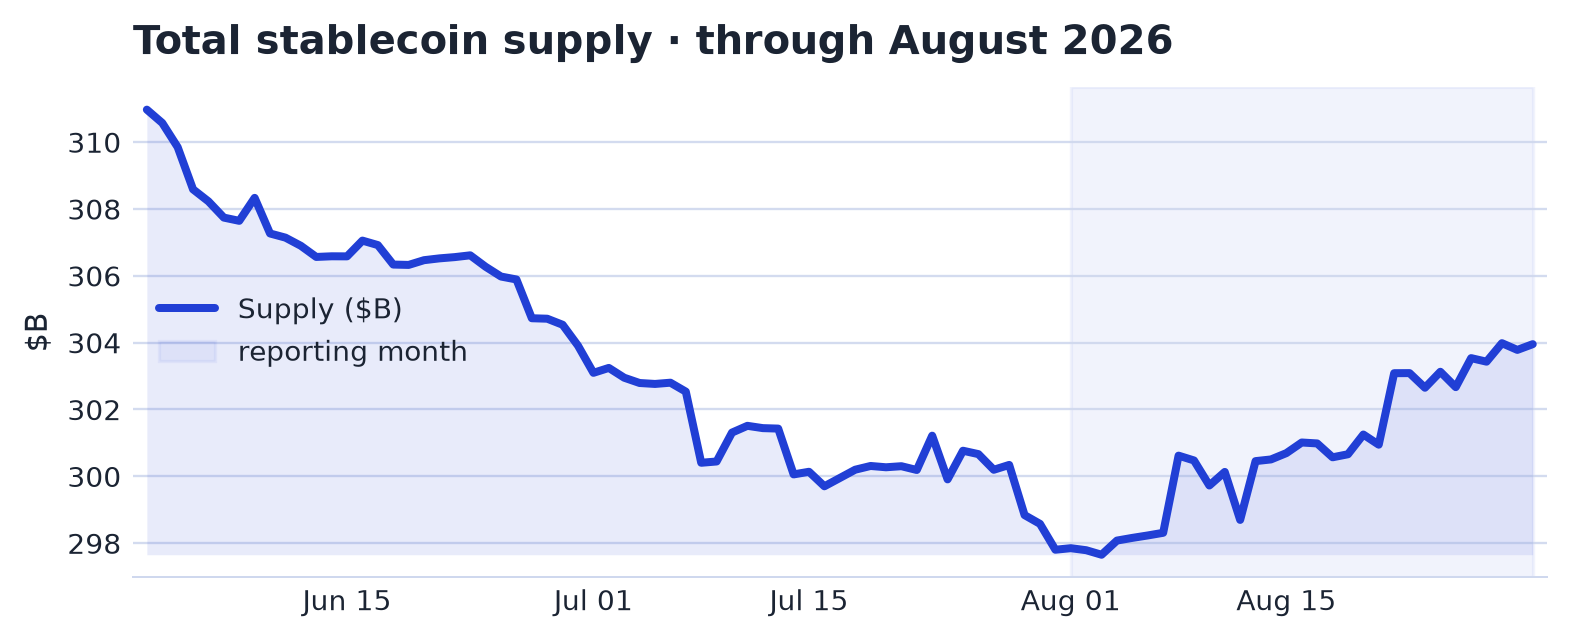
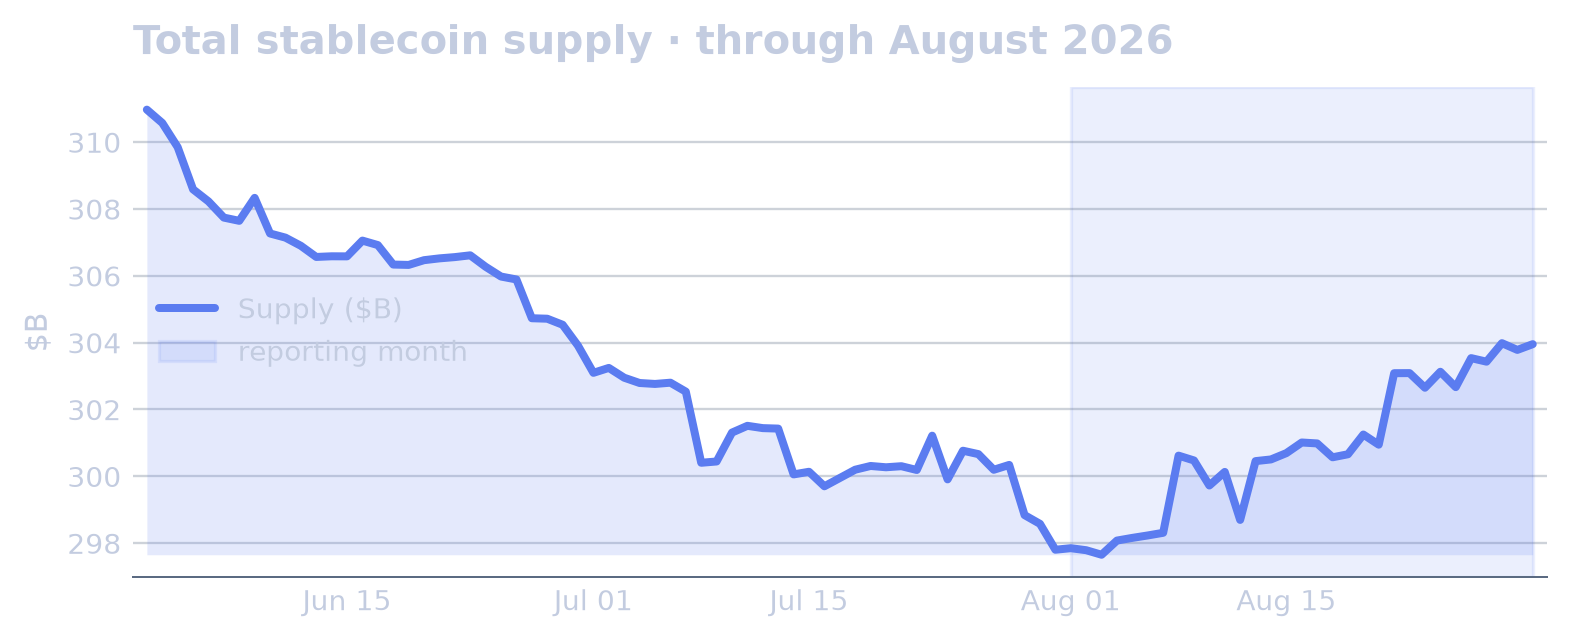
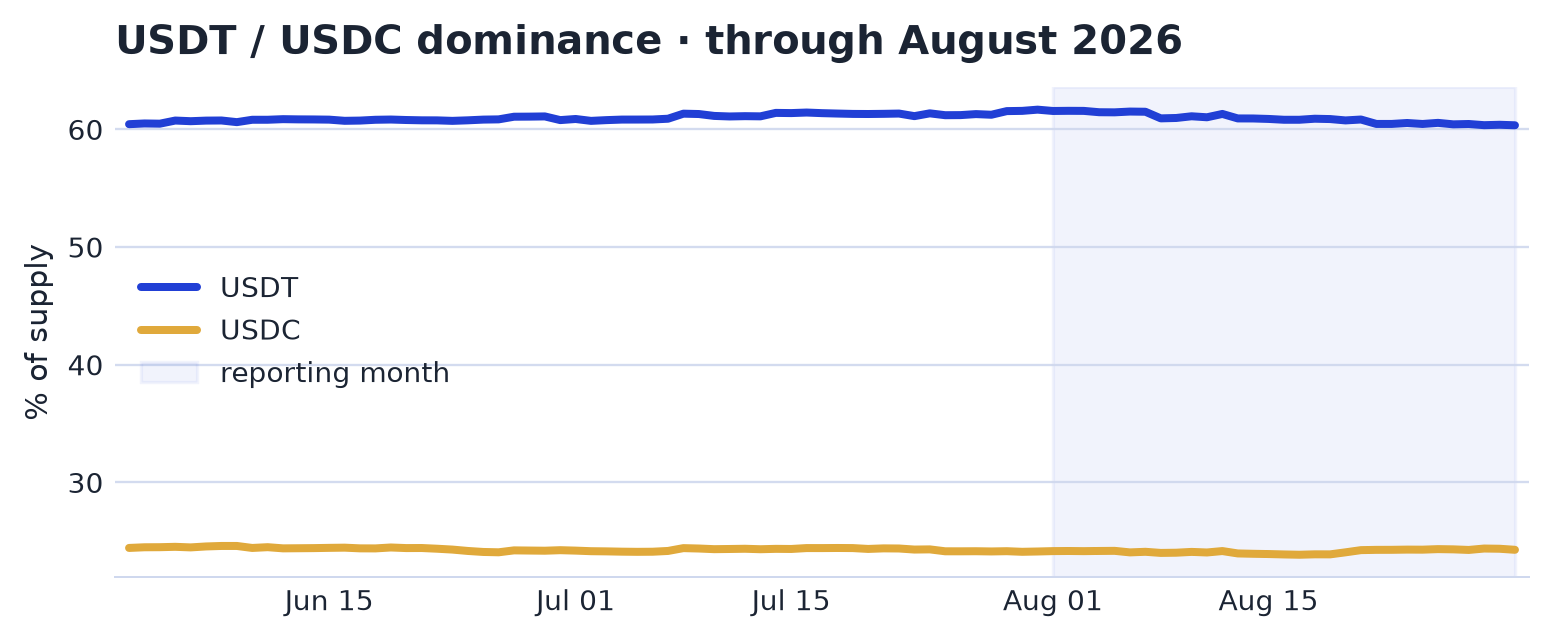
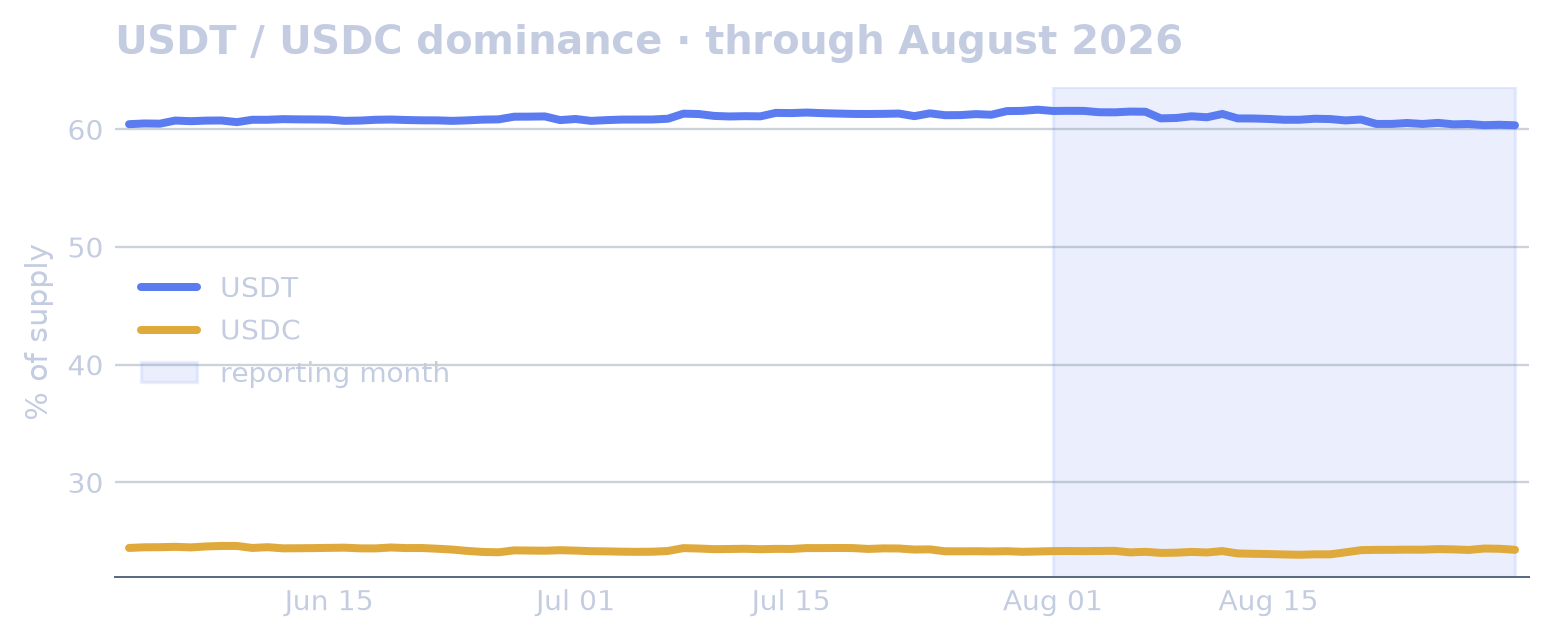
Total stablecoin supply began August at $297.85B and ended at $303.95B, a 2.05% increase that reversed the July 2026 decline. Market share shifted modestly: USDT dominance fell from 61.5% to 60.7%, down 0.7 percentage point, while USDC dominance rose from 24.1% to 24.4%, up 0.3 percentage point.
The month’s largest expansion among tracked coins above $1B came from RLUSD, Ripple’s dollar token, which rose 64.1% to $2.40B; the increase was a 4.7σ move, 4.7 times the series’ typical variation over the baseline window. U, a dollar stablecoin, gained 15.6% to $1.27B, USDE, Ethena’s dollar token, rose 6.1% to $4.11B, USD1 gained 5.0% to $4.19B, PYUSD rose 3.6% to $2.81B, and USDC increased 2.5% to $73.73B. Declines were concentrated in USDF, which fell 5.8% to $1.34B, and USDD, which fell 5.6% to $1.50B.
Concentration of supply changes sharpened around the late-month expansion. On August 22, total market capitalization rose 0.71% day over day, a 3.5σ move, 3.5 times the series’ typical variation over the baseline window; USDC accounted for 69% of the move, followed by USDT at 19%, RLUSD at 17%, and PYUSD at 8%. RLUSD also rose 7.38% that day, a 3.4σ move, 3.4 times the series’ typical variation over the baseline window, and by August 31 its market cap stood at the highest level since April 9, 2025. USDD had reached its highest level since April 9, 2025, on August 1, while U reached its highest level since December 18, 2025, on August 24.
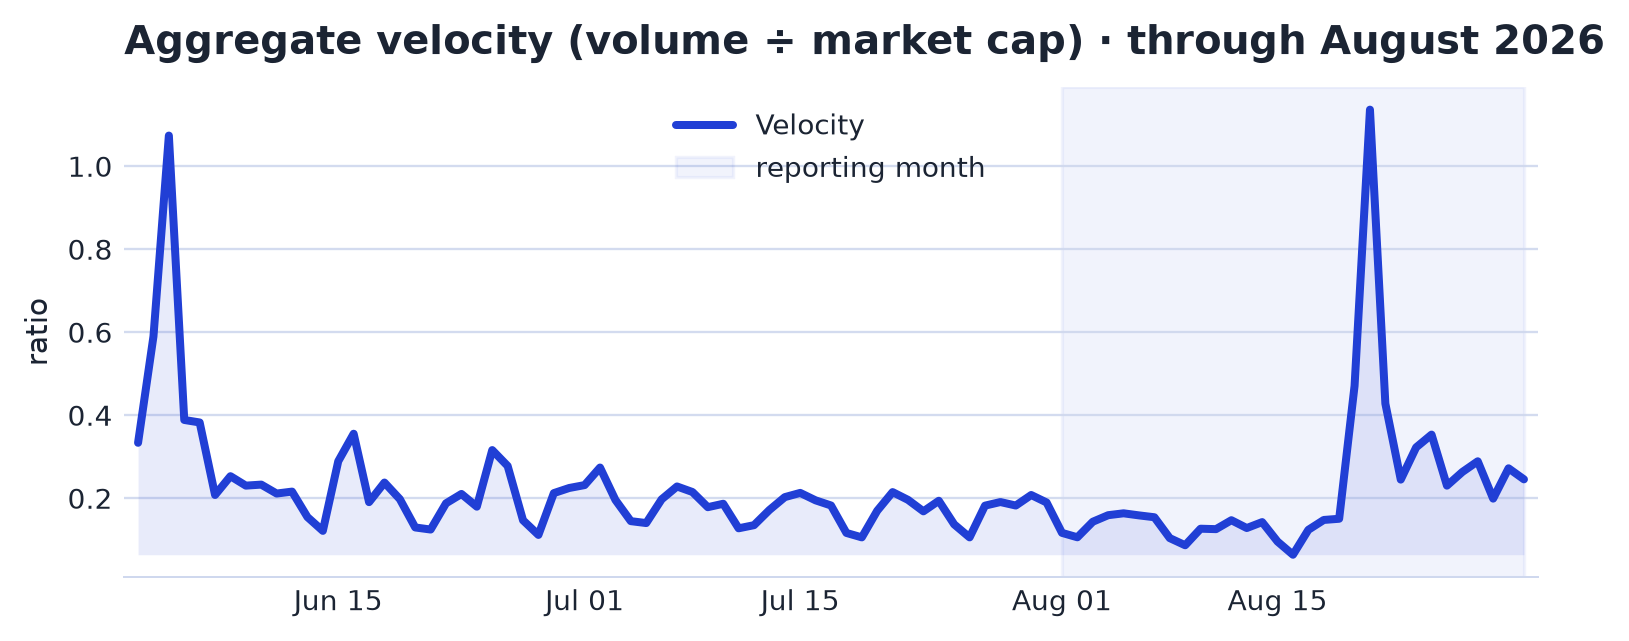
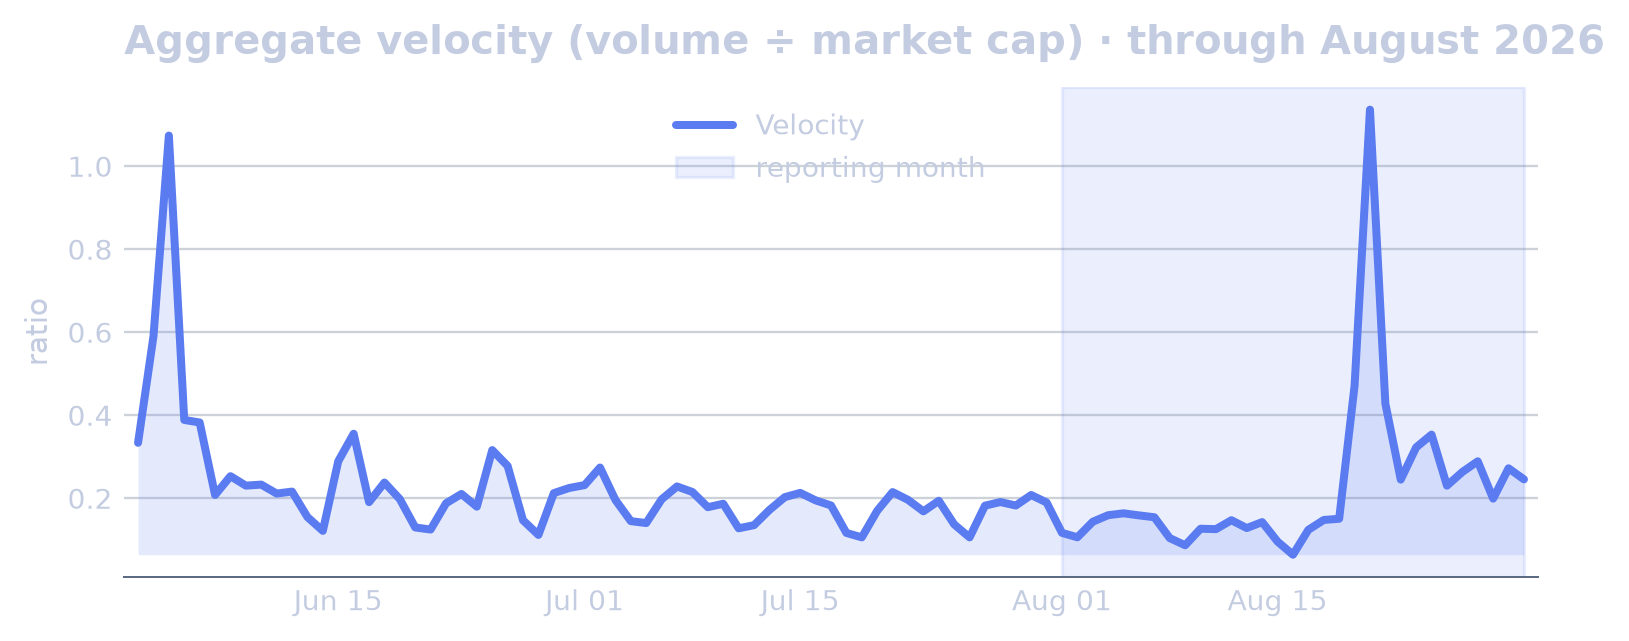
Trading intensity also registered a discrete late-month spike. On August 21, aggregate velocity, measured as volume relative to market capitalization, reached its highest level since April 9, 2025, with day-over-day increases of 213.60%, a 5.1σ move, 5.1 times the series’ typical variation over the baseline window, and 141.55%, a 3.4σ move, 3.4 times the series’ typical variation over the baseline window.
Concentration & Competition
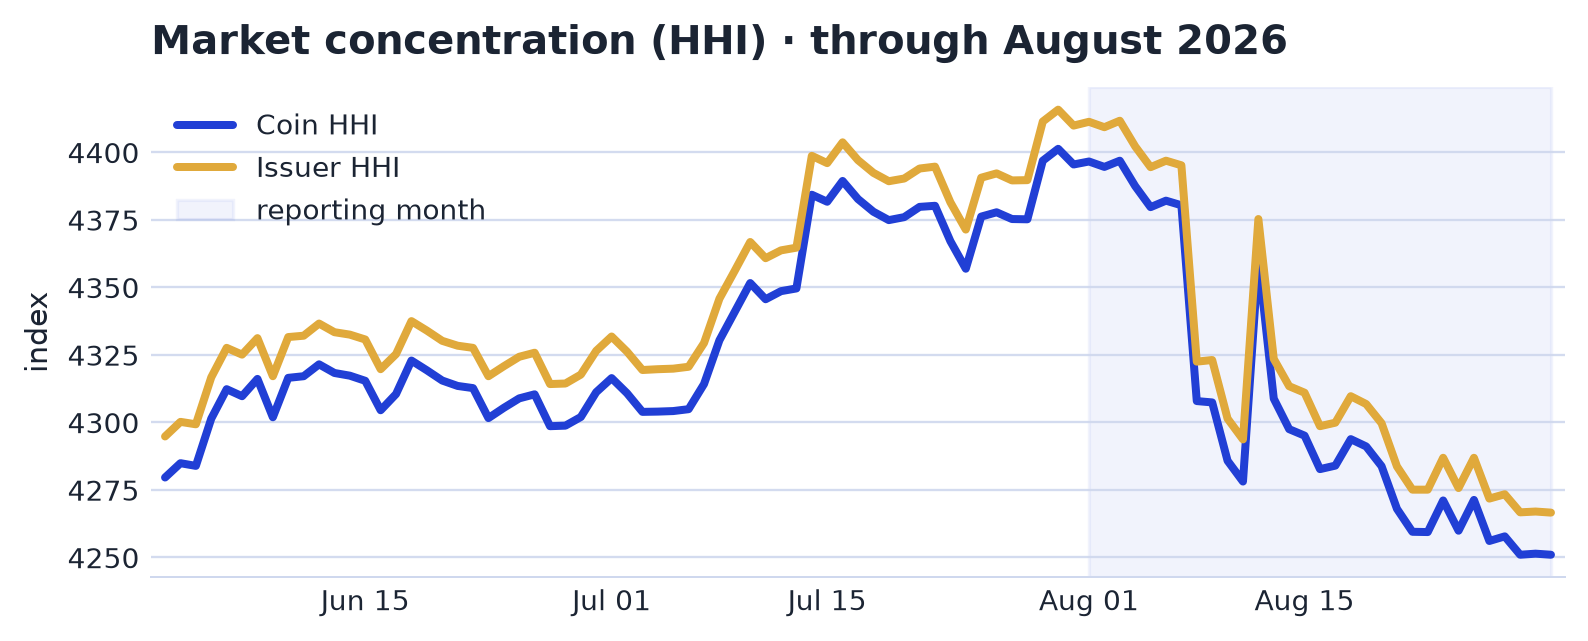
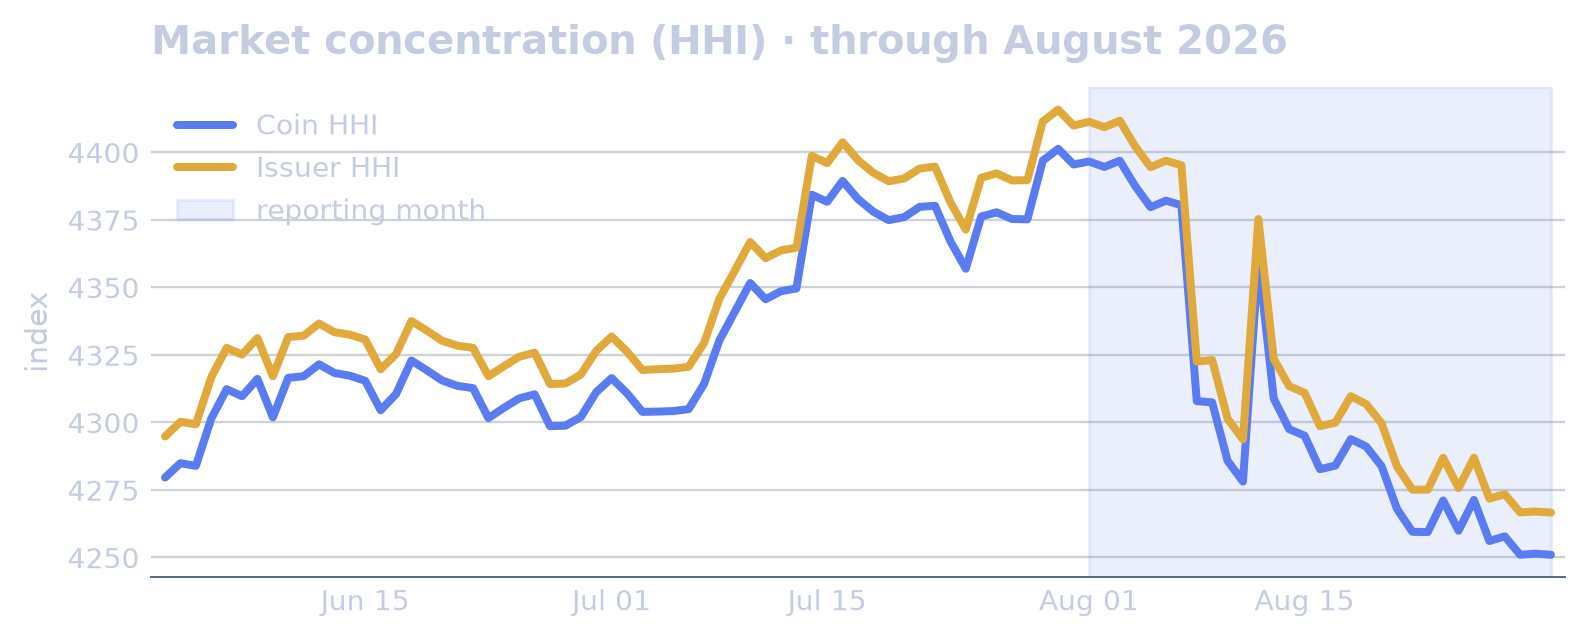
Concentration eased in August. The market HHI fell from 4,397 to 4,251, a 3.31% decline that reversed July’s rise, while the issuer HHI moved from 4,411 to 4,267, down 3.28% and also reversing the prior month’s increase. The issuer Theil index declined more modestly, from 3.97 to 3.93, a 0.86% fall that reversed July’s rise. The tracked stablecoin count moved from 178 to 175, so the concentration read rested primarily on the market and issuer HHIs, with the Theil measure treated more cautiously.
The main adjustment came on August 8. Issuer HHI fell 1.65% day over day, a -7.1σ move, 7.1 times the series’ typical variation over the baseline window; Tether accounted for 139% of the decline, while Circle offset 38% in the opposite direction. The coin-level market HHI moved in parallel, declining 1.66% day over day, a -7.0σ move, 7.0 times the series’ typical variation over the baseline window; USDT accounted for 139% of the fall, while USDC offset 38%. Over the same interval, total market capitalization rose 0.77% day over day, a +3.8σ move, 3.8 times the series’ typical variation over the baseline window, with USDC accounting for 210% of the increase, PYUSD 33%, and USDE 18%, while USDT offset 210% in the opposite direction.
Volatility in concentration stayed elevated through the month. Issuer HHI realized volatility ran at 2.3x its baseline, with Tether accounting for 123% of that move and Circle offsetting 22%; coin-level market HHI realized volatility also ran at 2.3x baseline, with USDT accounting for 123% and USDC offsetting 22%. The issuer Theil T index also fell 0.55% day over day on August 8, a -4.3σ move, 4.3 times the series’ typical variation over the baseline window, while its monthly mean stood 2.3σ above baseline, 2.3 times the series’ typical variation over the baseline window.
Regulatory Compliance (GENIUS & MiCA)
| Coin | Start of month | End of month | Change |
|---|---|---|---|
| USDC | $71.92B | $73.73B | +2.5% |
| PYUSD | $2.71B | $2.81B | +3.6% |
| USAT | $185M | $184M | -0.6% |
| USDP | $32M | $29M | -8.8% |
| Coin | Start of month | End of month | Change |
|---|---|---|---|
| USDC | $71.92B | $73.73B | +2.5% |
| EURC | $458M | $460M | +0.5% |
| EURCV | $155M | $182M | +17.4% |
| EURI | $38M | $38M | +0.8% |
| EURE | $32M | $33M | +1.5% |
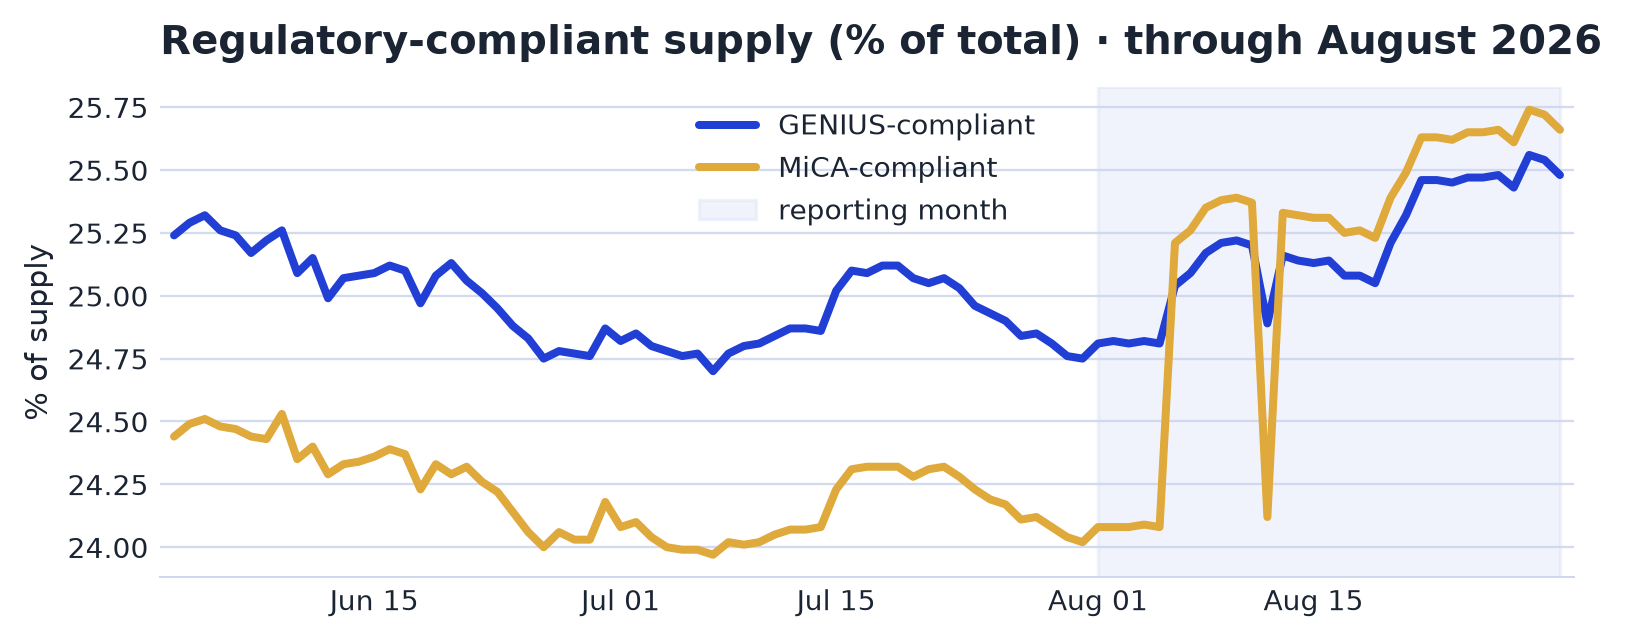
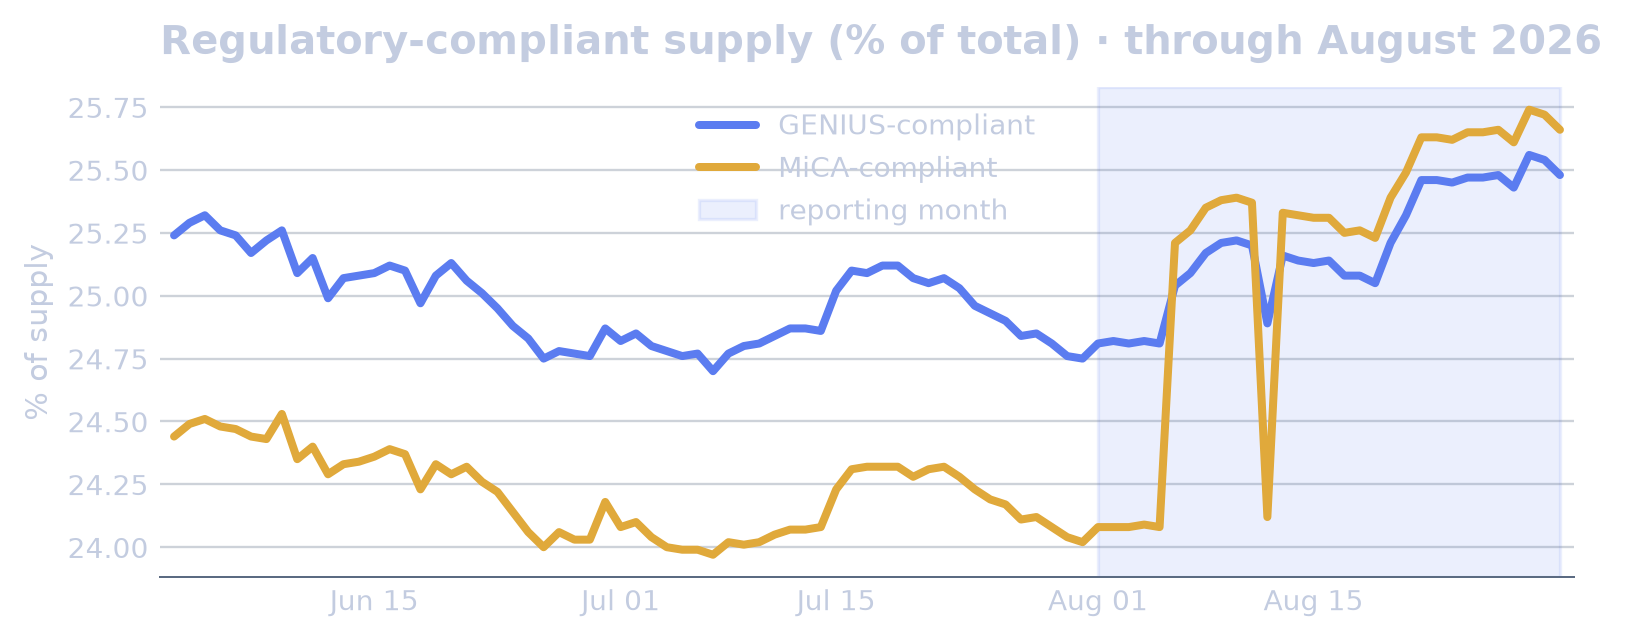
GENIUS Act-compliant supply stood at $73.94B at month-end, equal to 25% of total stablecoin supply, while MiCA-compliant supply stood at $74.45B, or 26% of the market. The two compliance buckets largely overlapped, as both consisted overwhelmingly of USDC; adding them together would double-count supply. USDT, the largest stablecoin, sat outside both frameworks, and most stablecoin supply was outside both regimes.
Regulatory activity centered on official-sector rulemaking, cross-border controls, and market access. The US Treasury moved forward with rules on the GENIUS Act after the July deadline, while separate coverage asked whether exempting synthetic stablecoins opens a back door. The US accounting board FASB proposed conditions for stablecoins as cash equivalents, and the US and UK reaffirmed support for stablecoins and tokenization in joint financial regulation talks.
Outside the US and Europe, South Korean stablecoin outflows topped $367M in June, South Africa planned exchange controls for offshore crypto and stablecoin flows, and Russia proposed exchange trading of Bitcoin, Ether, and Tether’s USDT. In licensing, ARP Digital secured a Dubai VARA broker-dealer license.
Peg Currency & Dollarisation
| Segment | End of month | % of total | Avg (month) | vs prev month |
|---|---|---|---|---|
| USD | $287.51B | 99.1% | $287.86B | ▼ -3.9% |
| EUR | $752M | 0.3% | $743M | ▲ +1.6% |
| GBP | $28M | 0.0% | $29M | ▼ -12.9% |
| CHF | $48M | 0.0% | $53M | ▲ +12.8% |
| JPY | $157M | 0.1% | $166M | ▲ +122.5% |
| SGD | $12M | 0.0% | — | — |
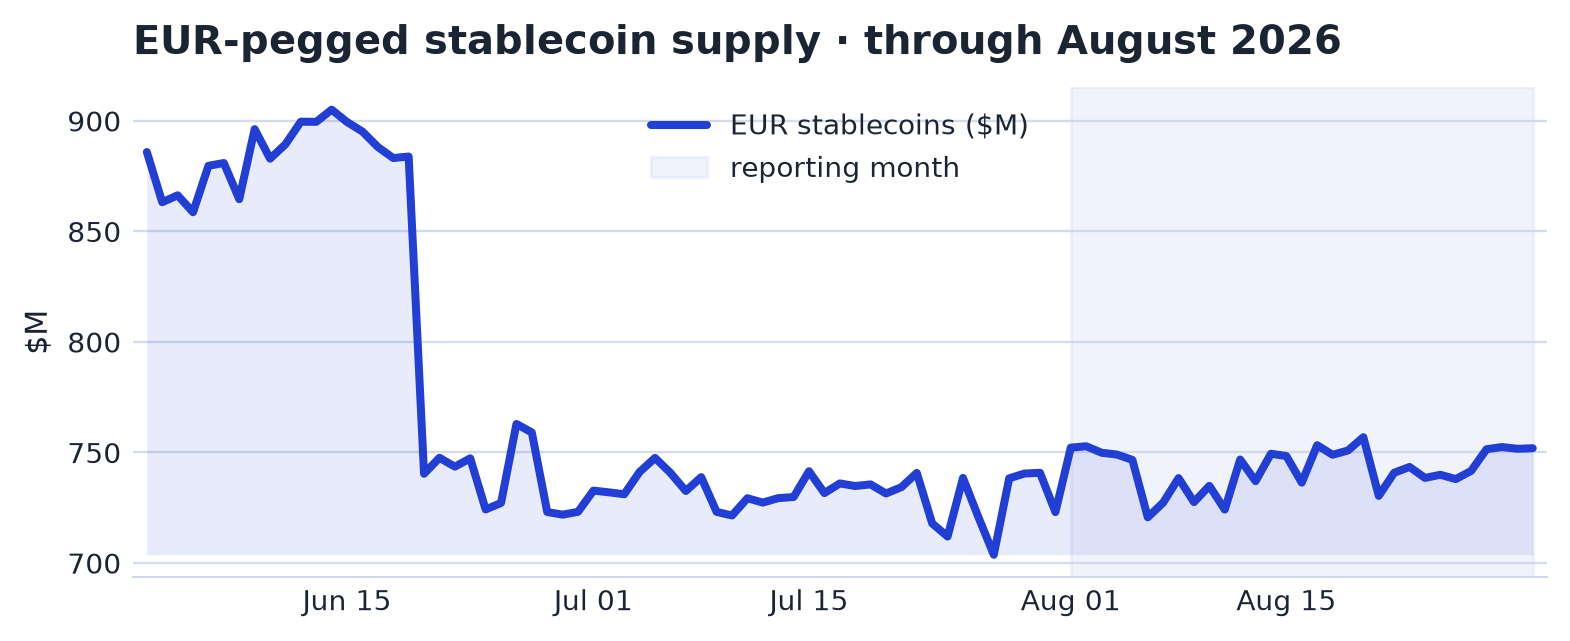
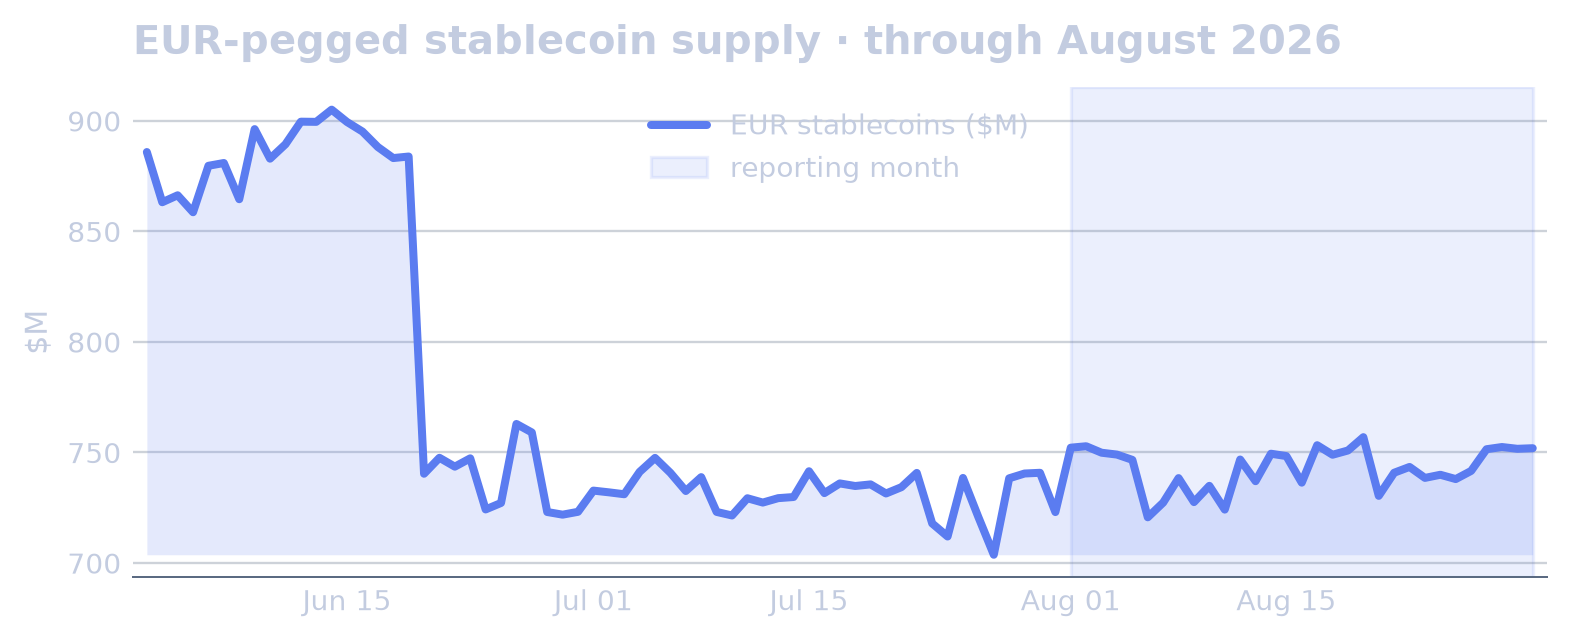
At the end of August 2026, USD-pegged stablecoins accounted for 99.1% of all supply, leaving peg-currency diversification confined to the non-USD long tail. Dollarization therefore remained the defining feature of stablecoin supply.
Within non-USD pegs, the euro remained the center of gravity. EUR-pegged supply stood at $752M, the largest non-USD peg, and MiCA-compliant euro coins drove its leadership. Other currency pegs, including GBP, CHF, and JPY, were nascent.
Backing & Collateral Types
| Segment | End of month | % of total | Avg (month) | vs prev month |
|---|---|---|---|---|
| Fiat-backed | $276.75B | 95.4% | $277.24B | ▼ -4.0% |
| Crypto-backed | $4.33B | 1.5% | $5.25B | ▼ -41.8% |
| Algorithmic | $1.57B | 0.5% | $1.60B | ▲ +1.1% |
| US Treasury-backed | $2.21B | 0.8% | $2.17B | → -0.4% |
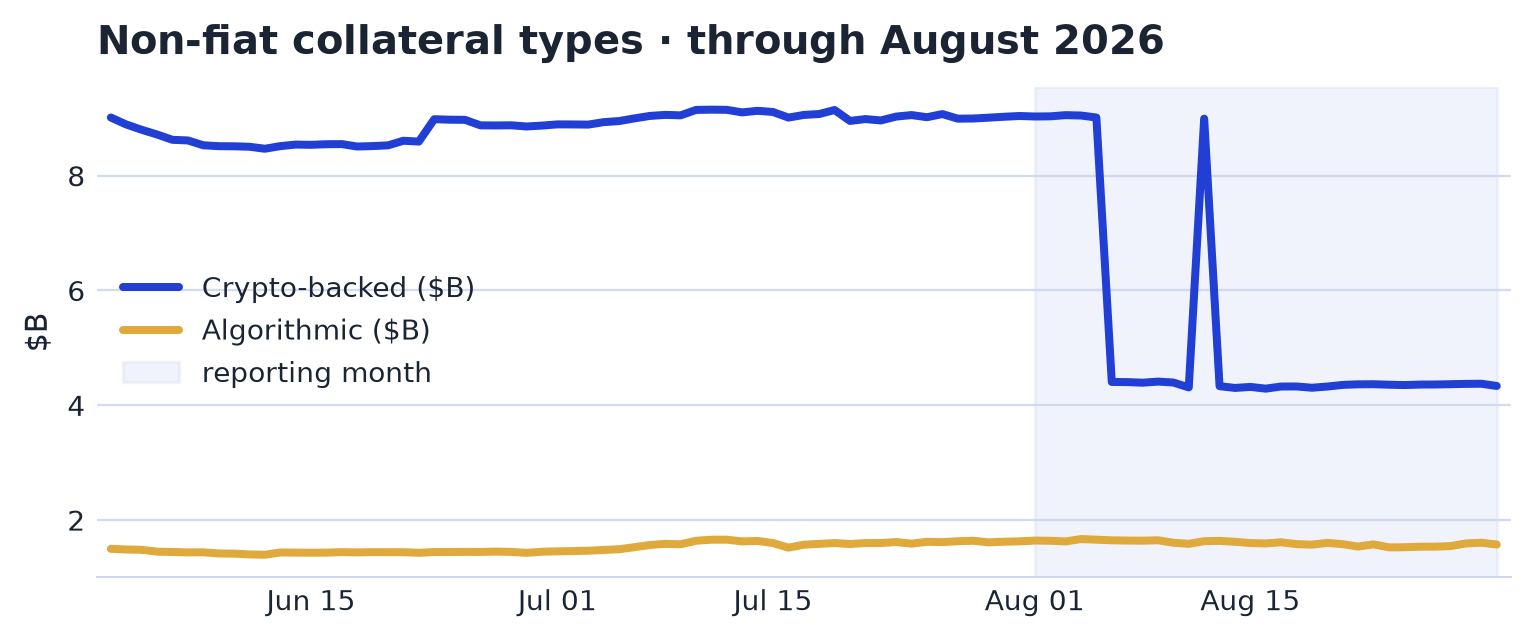
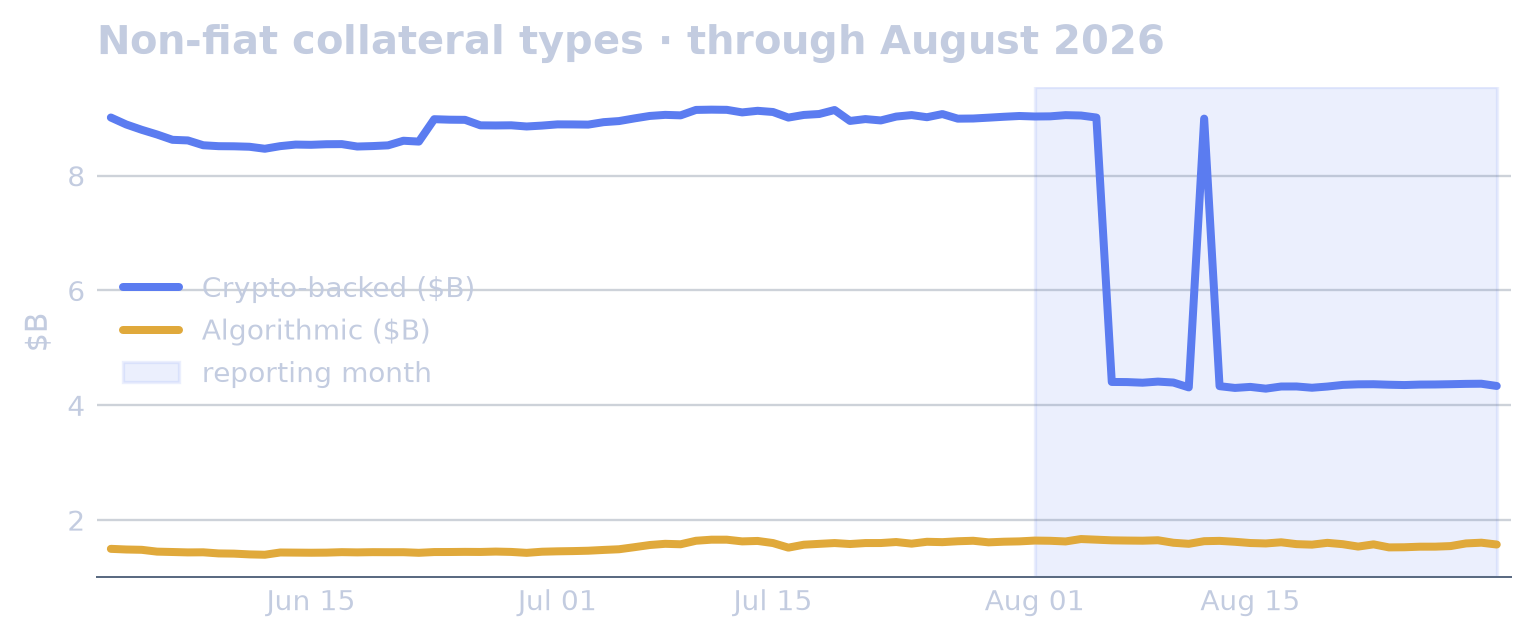
At end-August, fiat-backed stablecoins remained the center of the collateral mix, at $276.75B, or 95.4% of supply. The smaller backing categories were much narrower: crypto-backed stablecoins stood at $4.33B, or 1.5% of supply; algorithmic stablecoins at $1.57B, or 0.5%; and US Treasury-backed stablecoins at $2.21B, or 0.8%. Backing categories were measured independently, with overlap and snapshot differences allowed in the classification, so the category figures may differ from headline supply when summed.
The composition remained overwhelmingly fiat-backed, while the crypto-backed and algorithmic segments formed the small tail of the market. Backing type described the reserve model; reserve quality varies by issuer.
Peg Stability & Risk
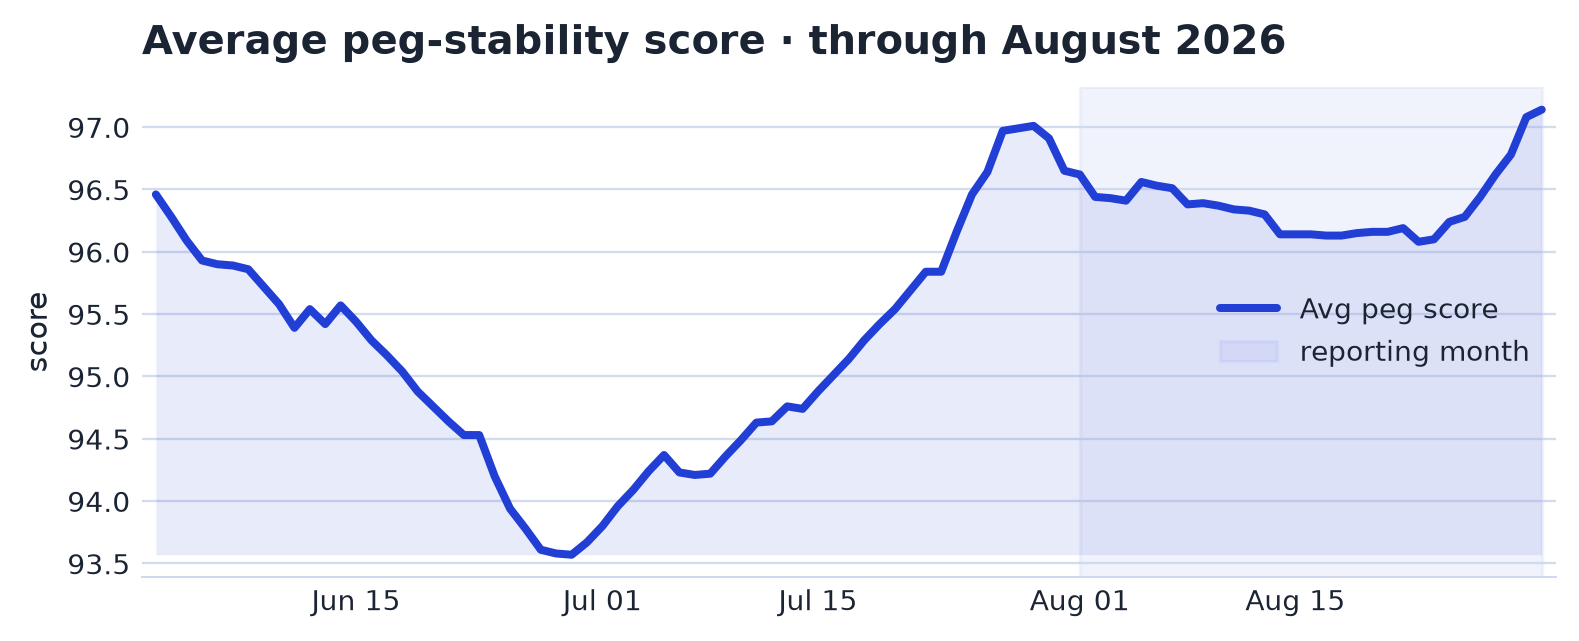
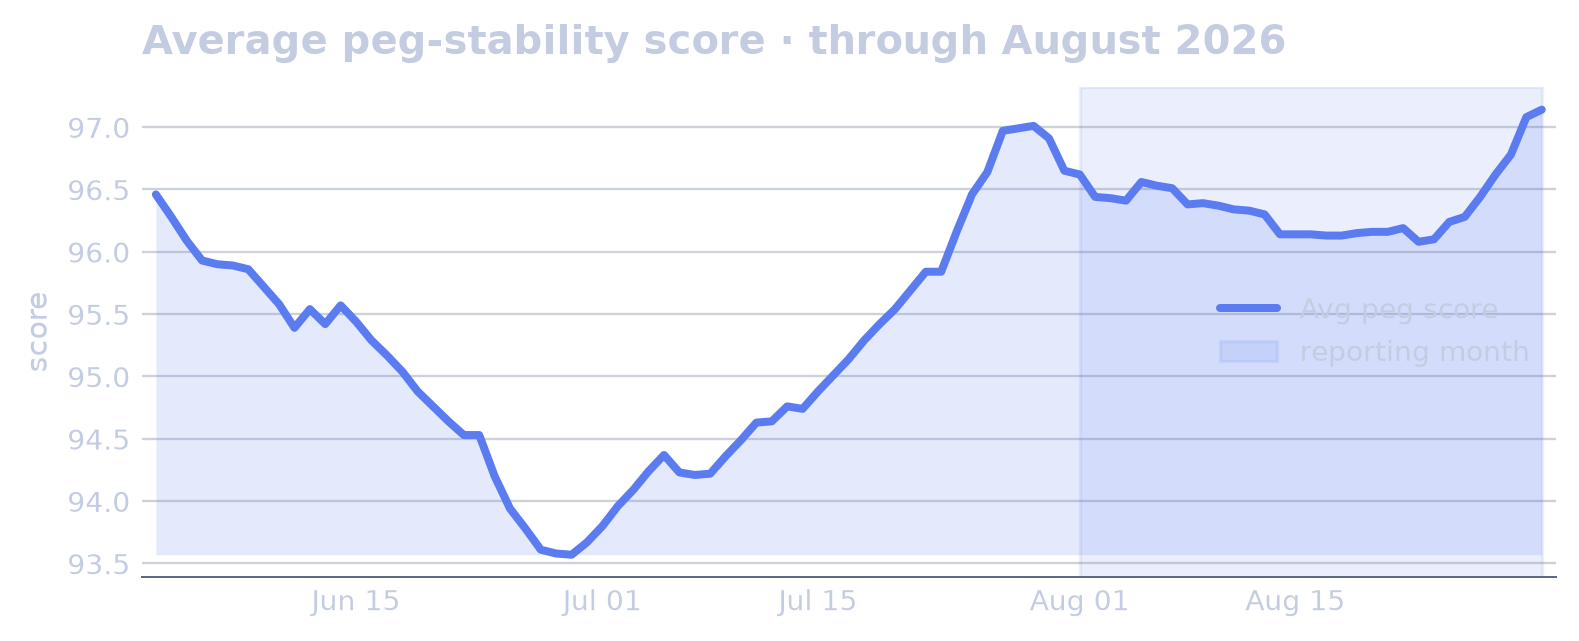
The average peg score was a 0-100 stability score, separate from price or dollar-value measures, for dollar-pegged coins, where 100 meant holding $1.00 all month and lower readings captured drift and off-peg days; euro- and other-currency stablecoins sat outside the measure because they required an FX reference. The score rose from 96.6 at the start of August to 97.1 at month-end, a 0.54% increase. Coins off-peg stood at 0 at both points. The worst deviation eased from 0.48% to 0.42%, falling for a third consecutive month, while 30-day depeg events declined from 7 to 4, falling for a second consecutive month.
The month’s stress points did not alter the end-month off-peg count. On 2026-08-01, the off-peg count registered its lowest reading in the data since 2025-04-09 and reached a peak of 1. The maximum depeg deviation exceeded 0.50% on 2026-08-02, with a peak of 1.10%. Depeg-event activity later concentrated on 2026-08-23, when total 30-day depeg events peaked at 10 before ending August at 4.
Trading Activity & Turnover
| Coin | Market cap | 24h volume | Turnover |
|---|---|---|---|
| USD1 | $4.19B | $1.47B | 35% |
| USDT | $183.37B | $55.11B | 30% |
| USDG | $3.32B | $807M | 24% |
| USDC | $73.73B | $15.50B | 21% |
| U | $1.27B | $171M | 13% |
| DAI | $4.58B | $292M | 6% |
| RLUSD | $2.40B | $125M | 5% |
| PYUSD | $2.81B | $77M | 3% |
At end-August, aggregate stablecoin velocity stood at 0.2449, measured as 24-hour volume relative to market capitalization. That level sat above the about 0.15 threshold associated with payment-like turnover, placing trading activity in that turnover range.
August recorded no trading-activity events.
Network Distribution
| Network | End of month | Avg (month) | Range (min – max) | vs prev month |
|---|---|---|---|---|
| Ethereum | $147.90B | $146.94B | $146.18B – $148.38B | ▼ -2.1% |
| Tron | $93.40B | $92.08B | $91.01B – $93.42B | ▲ +1.8% |
| Solana | $15.74B | $15.66B | $15.31B – $16.22B | ▲ +2.6% |
| BSC | $13.91B | $13.91B | $13.36B – $17.52B | → +0.4% |
| Hyperliquid L1 | $6.82B | $6.44B | $6.16B – $6.92B | ▲ +4.2% |
| Base | $4.91B | $4.87B | $4.74B – $4.98B | ▲ +1.4% |
| Arbitrum | $3.66B | $3.57B | $3.44B – $3.68B | ▼ -2.3% |
| Polygon | $3.10B | $3.08B | $3.02B – $3.49B | ▼ -6.5% |
| X Layer | $1.91B | $2.03B | $1.91B – $2.09B | ▲ +5.1% |
| Avalanche | $1.41B | $1.52B | $1.41B – $1.65B | ▼ -1.3% |
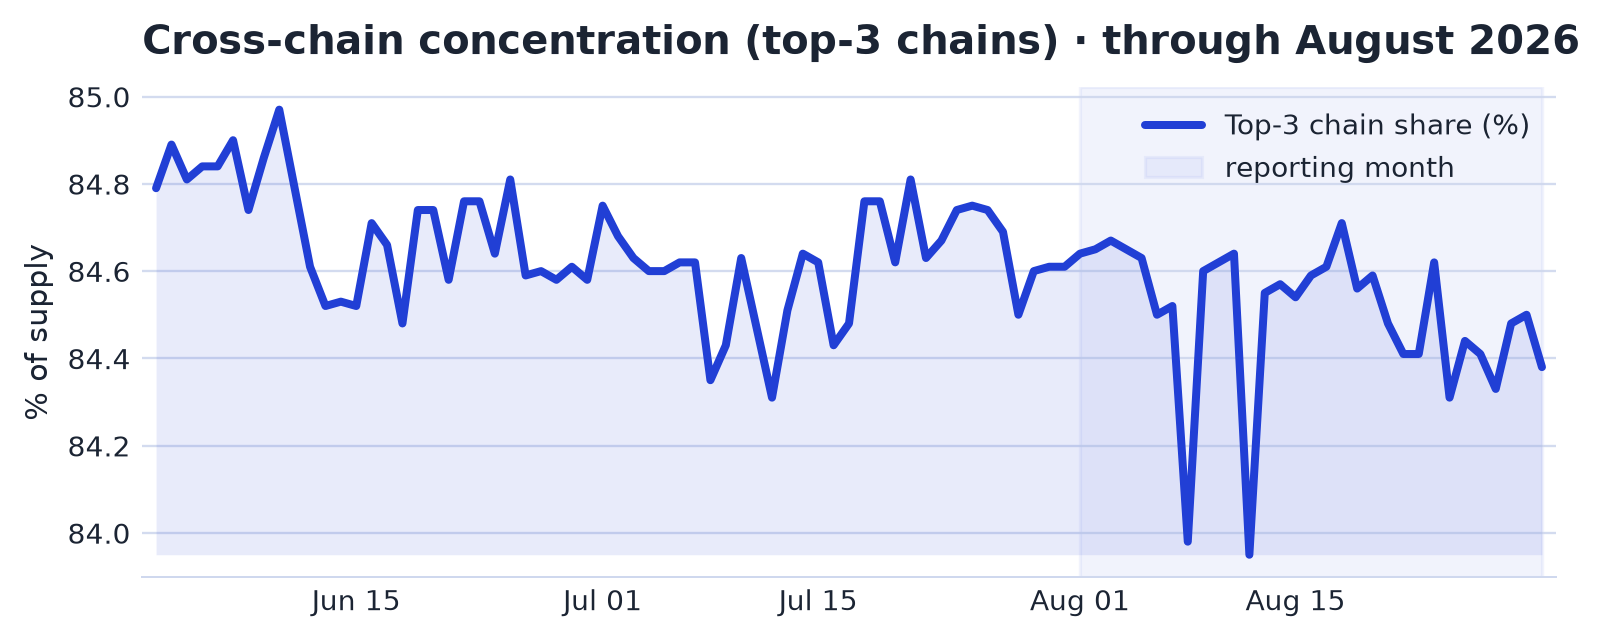
At end-August 2026, stablecoin supply was concentrated across blockchains. The top three chains accounted for 84.4% of supply, and the largest single chain held 48.5%. Cross-chain entropy stood at 2.27 bits, with supply predominantly situated on a small number of networks.
Yield-Bearing & Tokenized-Dollar Instruments
The yield-bearing and tokenized-dollar segment ended August at $13.78B across 90 tracked instruments, up $154M, or 1.1%, from the previous month. Tokenized commodity instruments stood separately at $54M across 1 tracked instrument, up $4M, or 8.1%. These instruments sat adjacent to the stablecoin market and outside headline stablecoin supply. Yield-bearing wrappers such as sUSDe and sUSDS were staked forms of underlying stablecoins, USDe and USDS, whose base supply was already counted in the headline total; their value was therefore a subset of that supply and was excluded from additive supply calculations. Standalone tokenized-treasury instruments such as USDY were money-market-like instruments outside the stablecoin universe.
Among the main yield-bearing instruments, sUSDS, the staked USDS wrapper, ended the month at $4.70B after a $75M increase, while USDY, Ondo US Dollar Yield, stood at $2.18B after adding $32M. sUSDe, Ethena’s staked USDe, fell by $214M to $1.34B, leaving it close in size to BFUSD, which edged up $2M to $1.32B. Below those balances, syrupUSDC declined by $84M to $970M and syrupUSDT fell by $22M to $402M.
Smaller instruments recorded mixed increases. ONYC, OnRe Tokenized Reinsurance, rose by $38M to $285M, and Re Protocol reUSD increased by $66M to $236M. Overall, August’s adjacent yield-bearing and tokenized-dollar segment consisted of yield-oriented wrappers and tokenized-treasury-like products, separate from stablecoin supply growth.
Cross-Currents
The August net par-pegged supply change was +$3.66B, and the move was concentrated in a few products. USDC added +$1.81B, RLUSD, the Ripple USD stablecoin, added +$0.94B, and SOFID, a smaller dollar token, added +$0.31B; together they accounted for 84% of the net move. This figure covered the par-pegged universe only, so it differed from the report’s headline total-supply change, which used a broader instrument set.
Coverage narrowed while concentration also eased. The number of tracked par-pegged coins went from 178 to 175, a -2% change, while the market HHI moved -3.31%. The reduction in coverage coincided with a lower concentration reading.
GENIUS-compliant supply underperformed the par-pegged market in August. The GENIUS-compliant cohort changed -1.2% over the month, against +2.0% for total par-pegged supply. The comparison marked a weaker supply outcome for the compliant cohort over the same interval.
MiCA-compliant supply outperformed the par-pegged market. The MiCA-compliant cohort changed +2.5% over the month, against +2.0% for total par-pegged supply. The comparison placed MiCA-compliant supply modestly ahead of the broader par-pegged aggregate.
Peg instability moved unevenly across frequency and severity measures. Thirty-day depeg events changed -42.9%, while the average peg score changed +0.54% and the worst single deviation moved -14.1%. Frequency and severity moved in different directions, giving mixed readings on peg conditions for the month.
Macro & Crypto Backdrop
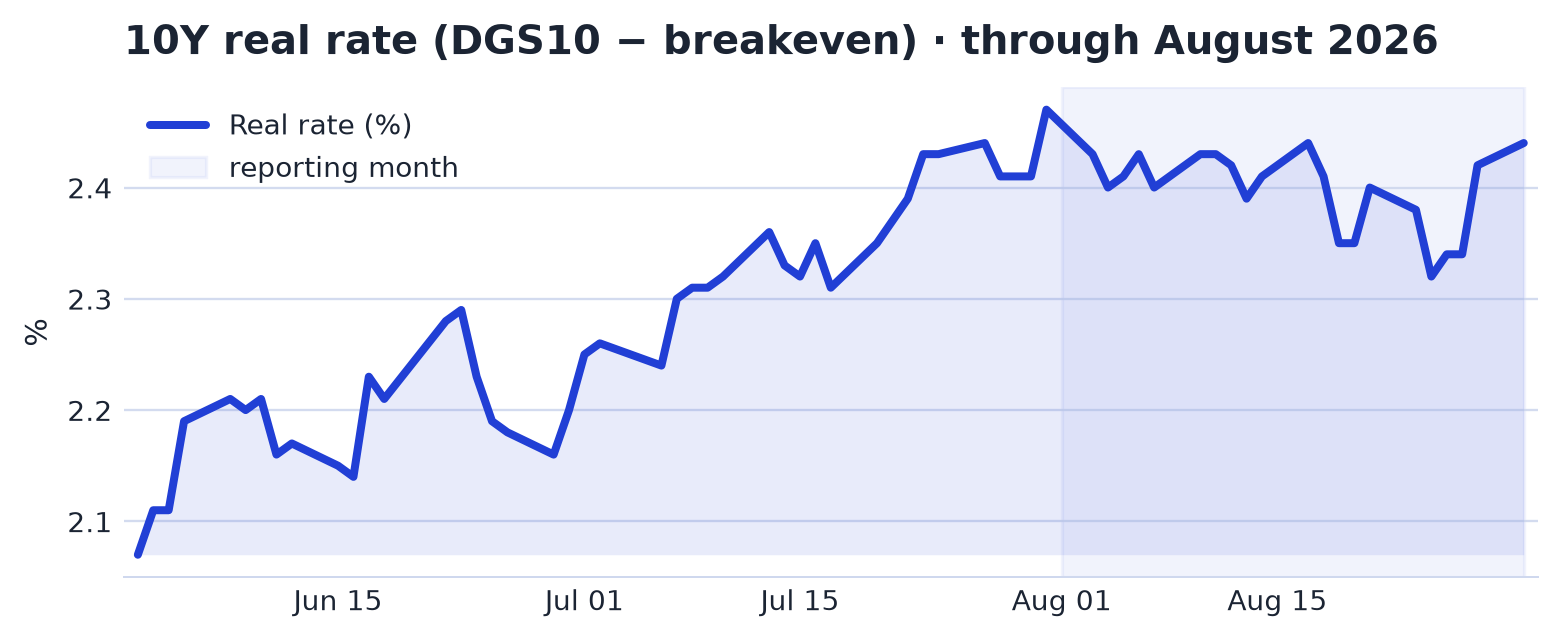
The rate picture was steady at the headline level but firmer beneath the surface. The US 10-year yield held at 4.75% from start to end, a +0.00% change, while the 10-year real rate slipped from 2.47% to 2.44%, down 1.21% and reversing July’s rise. The broad dollar index fell from 120 to 119, down 0.80% and lower for a second consecutive month. Risk indicators improved: the VIX declined from 15.99 to 14.92, down 6.69% and reversing July’s rise, while Bitcoin rose from $63,049 to $78,418, up 24.38% for a second consecutive monthly gain. Bitcoin dominance increased from 56.27% to 59.19%, up 5.19% and also higher for a second month, and the Fear & Greed index rose from 27.00 to 62.00, a 129.63% increase and a second consecutive monthly rise.
Rates remained elevated through the month despite the flat start-to-end 10-year yield. The US 10-year yield’s month mean stood 2.4σ above baseline, a 2.4σ reading, 2.4 times the series’ typical variation over the baseline window. The 10-year real rate’s month mean stood 2.6σ above baseline, a 2.6σ reading, 2.6 times the series’ typical variation over the baseline window; 10-year breakeven inflation accounted for 100% of that move. Macro headlines clustered around persistent inflation, high long-term borrowing costs, and central bank price-stability concerns, while the geopolitical thread centered on widened US sanctions against Iran, retaliation threats, and later Strait of Hormuz hostilities. Those developments accompanied the elevated nominal and real-rate readings. The broad dollar index was volatile early in the month, with a 0.97% day-over-day decline on August 4, a -4.4σ move, 4.4 times the series’ typical variation over the baseline window, and a related 0.89% day-over-day increase, a +4.0σ move, 4.0 times the series’ typical variation over the baseline window.
Crypto conditions strengthened alongside the softer dollar and lower VIX. Bitcoin’s 24.4% monthly gain was a +2.5σ move versus its typical 30-day move, 2.5 times the series’ typical variation over the baseline window. The sharpest price action clustered around August 20, when Bitcoin rose 8.61% day over day, a +3.8σ move, 3.8 times the series’ typical variation over the baseline window, alongside a related 7.48% day-over-day increase, a +3.3σ move, 3.3 times the series’ typical variation over the baseline window. Concentration rose at the same point in the month: Bitcoin dominance recorded a 3.44% day-over-day increase, a +9.4σ move, 9.4 times the series’ typical variation over the baseline window, and a related 1.17% day-over-day increase, a +3.2σ move, 3.2 times the series’ typical variation over the baseline window.