Total stablecoin supply fell from $302.52B to $298.76B in July, a -1.24% decline and the third consecutive monthly fall. Market share edged further toward USDT, whose dominance rose from 60.7% to 61.2%, a +0.4pp increase. USDC’s dominance slipped from 24.1% to 23.9%, a -0.2pp mov
Size & Growth
- Total supply
- $298.76B31 Jul 2026
- Net change
- −$3.8B-1.24% over month
- Top gainer
- USDG+$378M over month
Composition & Dominance
- USD-pegged
- 98.5%of supply
- Tether share
- 61.2%of supply
- Issuer HHI
- 4,392+48 MoM
Regulation & Stability
- GENIUS-compliant
- $74.71B25% of supply
- MiCA-compliant
- $72.52B24% of supply
- Avg peg score
- 86.44 coins off-peg
Contents
- News & Developments
- Analysis & Commentary
- Issuance & Lifecycle Events
- Market Structure & Supply
- Concentration & Competition
- Regulatory Compliance (GENIUS & MiCA)
- Peg Currency & Dollarisation
- Backing & Collateral Types
- Peg Stability & Risk
- Trading Activity & Turnover
- Network Distribution
- Yield-Bearing & Tokenized-Dollar Instruments
- Cross-Currents
- Macro & Crypto Backdrop
News & Developments
Stablecoin policy dominated July: Taiwan passed crypto and stablecoin regulations, officials were reported to be preparing MiCA revisions for non-EU issuers, and Circle won final approval for a US national trust bank charter. On the institutional side, Crédit Agricole launched a euro stablecoin, Visa launched a stablecoin platform, and payment and technology firms advanced stablecoin settlement and AI-agent payment initiatives.
Regulation & Policy
Regulatory activity centred on licensing, perimeter-setting and enforcement, with Taiwan’s legislature passing crypto and stablecoin regulations (Cointelegraph), while officials were reported to be preparing MiCA revisions to cover non-EU stablecoin issuers (Cointelegraph). In the US, Circle won final approval for a national trust bank charter (Cointelegraph), as the American Bankers Association and state banking groups pushed back on CLARITY Act stablecoin-yield provisions (Cointelegraph). Enforcement also remained prominent, with OFAC sanctioning 134 ISIS-K crypto wallet addresses as Tether froze funds (Cointelegraph), and FATF urging faster crypto AML enforcement as stablecoin crime increased (Cointelegraph). In Asia, the Bank of Korea stood by a bank-led stablecoin approach as deposit-token pilots advanced (Cointelegraph), while South Korea planned stablecoin rules alongside a separate opposition push to repeal crypto tax (Cointelegraph).
Issuance & Launches
Large financial institutions and issuers added to the launch pipeline, and Tether reported results: Crédit Agricole, the French banking group, launched the EURXT euro stablecoin (Cointelegraph), and Sony Bank received US regulatory approval to issue stablecoins (Cointelegraph). Visa launched a stablecoin platform (Ledger Insights), while Tether reported $1.5 billion in Q2 profit as USDT supply grew and gold holdings rose (Decrypt).
Adoption & Partnerships
Adoption news was led by payment, banking and enterprise infrastructure initiatives, with JCB signing an MOU with Circle to test stablecoin payments in Japan (Cointelegraph), Philippine bank BPI planning a stablecoin payments pilot (Cointelegraph), and Hyundai completing a USDT treasury settlement pilot between the US and Mexico (Cointelegraph). AI-linked payments also moved into product development, as Cloudflare unveiled a stablecoin solution for AI-agent payments (Ledger Insights) and Coinbase enabled businesses to accept USDC payments from AI agents (Cointelegraph). Circle separately moved to acquire nearly 1,000 IBM blockchain patents (Cointelegraph), while PayPal expanded its stablecoin push as crypto assets factored into Q2 results (Cointelegraph) and Visa outlined its stablecoin strategy during its Q3 earnings call (Cointelegraph).
Other developments
Policy research bodies continued to flag financial-stability and capital-flow issues tied to stablecoins: an IMF paper said dollar stablecoins could improve FX access while amplifying currency runs (Cointelegraph), the BIS warned that stablecoins could weaken capital controls in emerging markets (Cointelegraph), and the IMF warned that Brazil’s stablecoin activity outpaced traditional capital flows (Cointelegraph). Separately, a planned merger involving Tether-backed Twenty One and Strike was scrapped, according to Bloomberg as reported by Cointelegraph.
Analysis & Commentary
Beyond the data, the desk published the following analysis during July 2026.
Open USD, Qivalis, and the Race to Own Stablecoin Settlement · 7 July 2026
Open USD, a dollar stablecoin backed by a 140-plus company consortium including Visa, Stripe, Mastercard and Coinbase, and Qivalis, a 37-bank euro stablecoin project, are best read not as new tokens but as competing bids to own the architecture of digital settlement. Both share reserve economics and governance more widely than the single-issuer model, and both are control projects dressed in the language of openness. Against a concentrated $302bn market (USDT 61 per cent, USDC 24.2 per cent, HHI 4,324), the next contest will be decided by governance, reserves, redemption, liquidity and access, not market cap. The better outcome is disciplined competition, not a new consortium gate or a state-controlled CBDC. Full analysis: stablecoinbeat.com/insights/open-usd-qivalis-stablecoin-settlement/
Do Stablecoins Cause Currency Crises? · 15 July 2026
A July 2026 IMF Working Paper by Brandon Joel Tan models stablecoins in fixed exchange-rate regimes as both an access technology and an information technology: they cut the cost of dollar hedging and turn many fragmented parallel prices into one public signal. In calm conditions that improves welfare; once a peg is badly misaligned, the same signal can help households coordinate an exit. Drawing on the paper, BIS spillover evidence and Bolivia's experience, the article argues stablecoins can intensify a currency crisis but rarely originate one, and that suppressing the price does not restore lost credibility. The better response is proportionate regulation of issuers, lawful low-value access, narrow and time-limited emergency tools, privacy-conscious data, and macroeconomic repair. Full analysis: stablecoinbeat.com/insights/do-stablecoins-cause-currency-crises/
Issuance & Lifecycle Events
| Date | Token | Event |
|---|---|---|
| 2026-07-08 | USDR / EURR | StablR published a further recovery-plan security update following the May multisig exploit that minted unbacked USDR and EURR; both tokens continued trading well below par. |
| 2026-07-10 | ctUSD | Citrea launched a ctUSD Earn Vault, extending its Treasury-backed stablecoin product on the Citrea Bitcoin rollup. |
| 2026-07-18 | USDH | The redemption portal for the Hyperliquid-ecosystem USDH closed, completing the wind-down announced in May when treasury duties moved to Coinbase-issued USDC. |
| 2026-07-24 | TUSD | TrueUSD announced an optional one-to-one conversion path from TUSD to USDD; TUSD issuance and redemption continue during the transition. |
| July 2026 | uUSD | Youves announced that sustaining maintenance of its Tezos-based uUSD is no longer viable and that a structured phase-out plan is in preparation, following an oracle-related emergency halt. |
| July 2026 | scUSD | Trevee announced the end of operations for its Plasma deployment and urged withdrawals; the scUSD stablecoin itself continues operating. |
The stablecoin population itself changed during July 2026. The table below records the month's notable lifecycle events: launches, wind-downs, migrations and post-incident developments, compiled from issuer announcements and public records. The list covers significant events, without any claim to completeness.
Market Structure & Supply
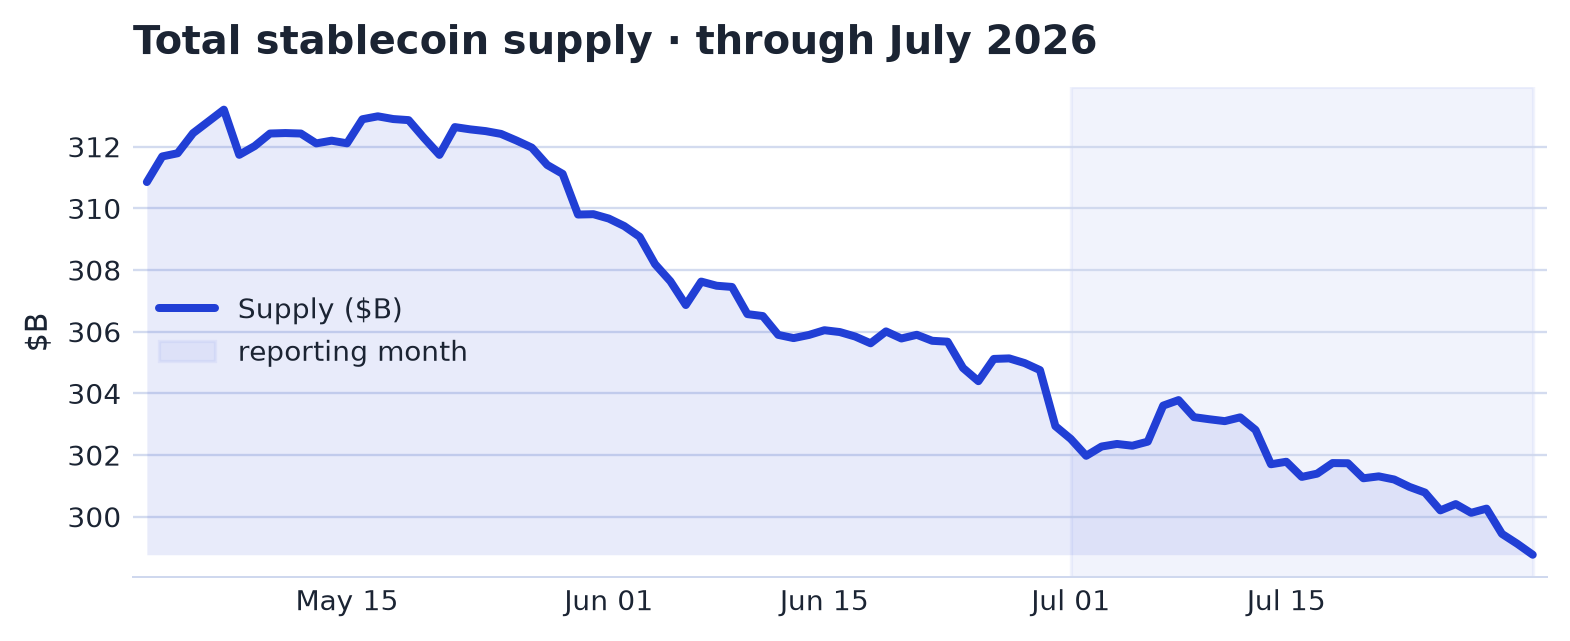
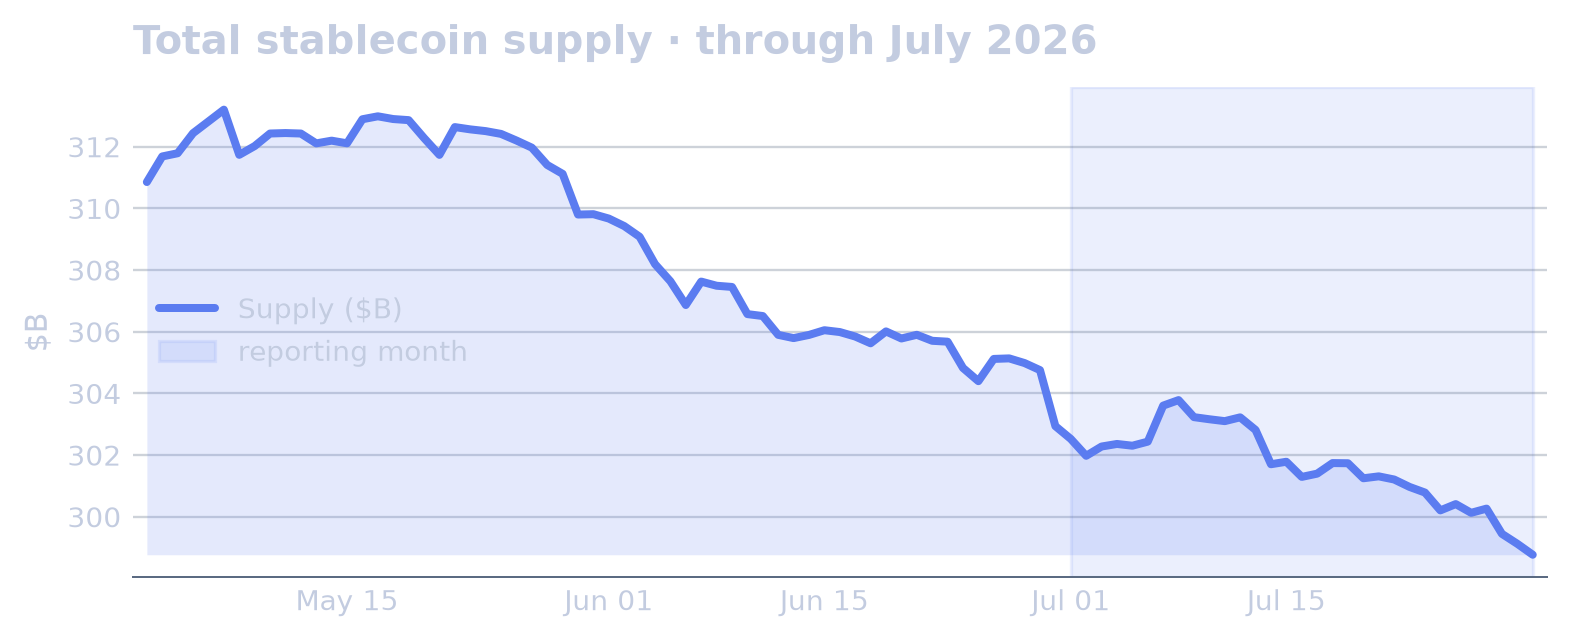
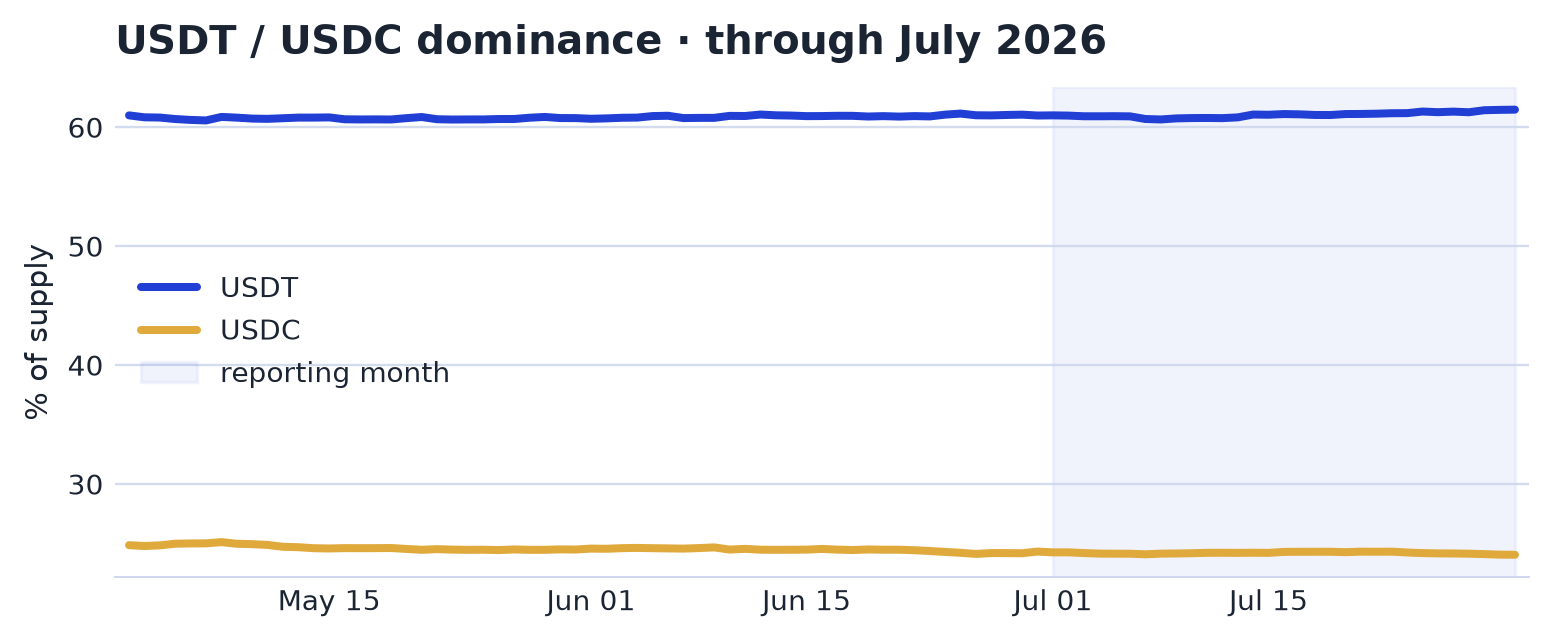
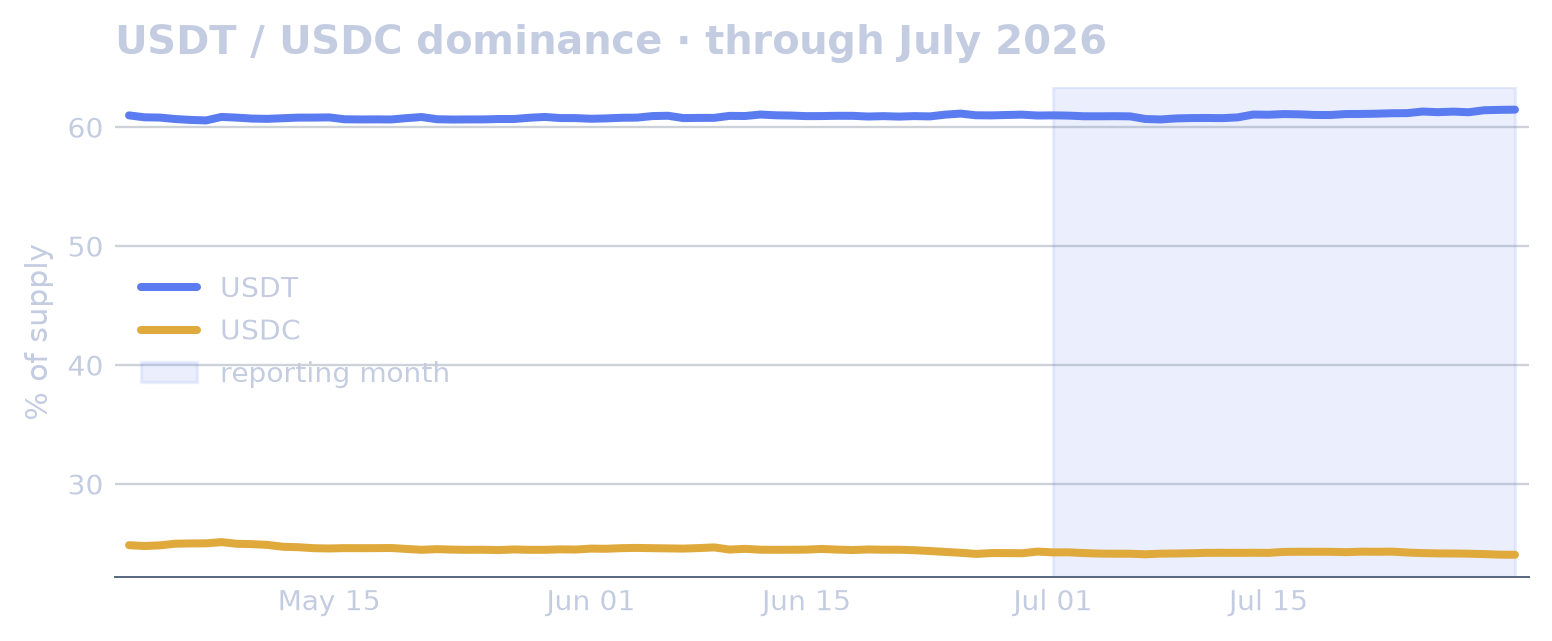
Total stablecoin supply fell from $302.52B to $298.76B in July, a -1.24% decline and the third consecutive monthly fall. Market share edged further toward USDT, whose dominance rose from 60.7% to 61.2%, a +0.4pp increase. USDC’s dominance slipped from 24.1% to 23.9%, a -0.2pp move, while its market cap declined -2.0% to $71.81B.
USDGO, a smaller tracked dollar coin, accounted for the most pronounced supply anomaly. Its monthly average market cap was at least 10.0σ above baseline, at least ten times the series’ typical variation over the baseline window, and realised volatility reached 4.5x its baseline. The mid-month expansion centred on 10 July, when USDGO recorded day-over-day market-cap increases of +7.21%, more than +10σ, more than ten times the series’ typical variation over the baseline window; +4.78%, a +9.7σ reading, 9.7 times the series’ typical variation over the baseline window; +2.33%, a +4.7σ reading, 4.7 times the series’ typical variation over the baseline window; and +1.52%, a +3.1σ reading, 3.1 times the series’ typical variation over the baseline window. The same episode included a mid-month level shift of 3.5σ, 3.5 times the series’ typical variation over the baseline window. A further USDGO increase on 23 July added +8.66% day over day, more than +10σ, more than ten times the series’ typical variation over the baseline window.
Among tracked coins with market capitalisation above $1B, USDGO rose +29.0% over the month to $1.11B, the largest gain in the group. Other increases were concentrated in USDD, the Tron-linked dollar, up +14.0% to $1.57B; USDG, a tracked dollar coin, up +12.7% to $3.36B; and RLUSD, Ripple USD, up +12.7% to $1.59B, after an 11.78% day-over-day market-cap rise on 2 July, a +5.7σ reading, 5.7 times the series’ typical variation over the baseline window. On the downside, USD1, a tracked dollar coin, fell -13.8% to $4.00B, USDE, Ethena’s dollar, declined -12.8% to $3.88B, and USDS, the Sky Protocol dollar, ended -3.0% lower at $9.71B despite an 8.75% day-over-day market-cap increase on 7 July, a +5.6σ reading, 5.6 times the series’ typical variation over the baseline window.
Concentration & Competition
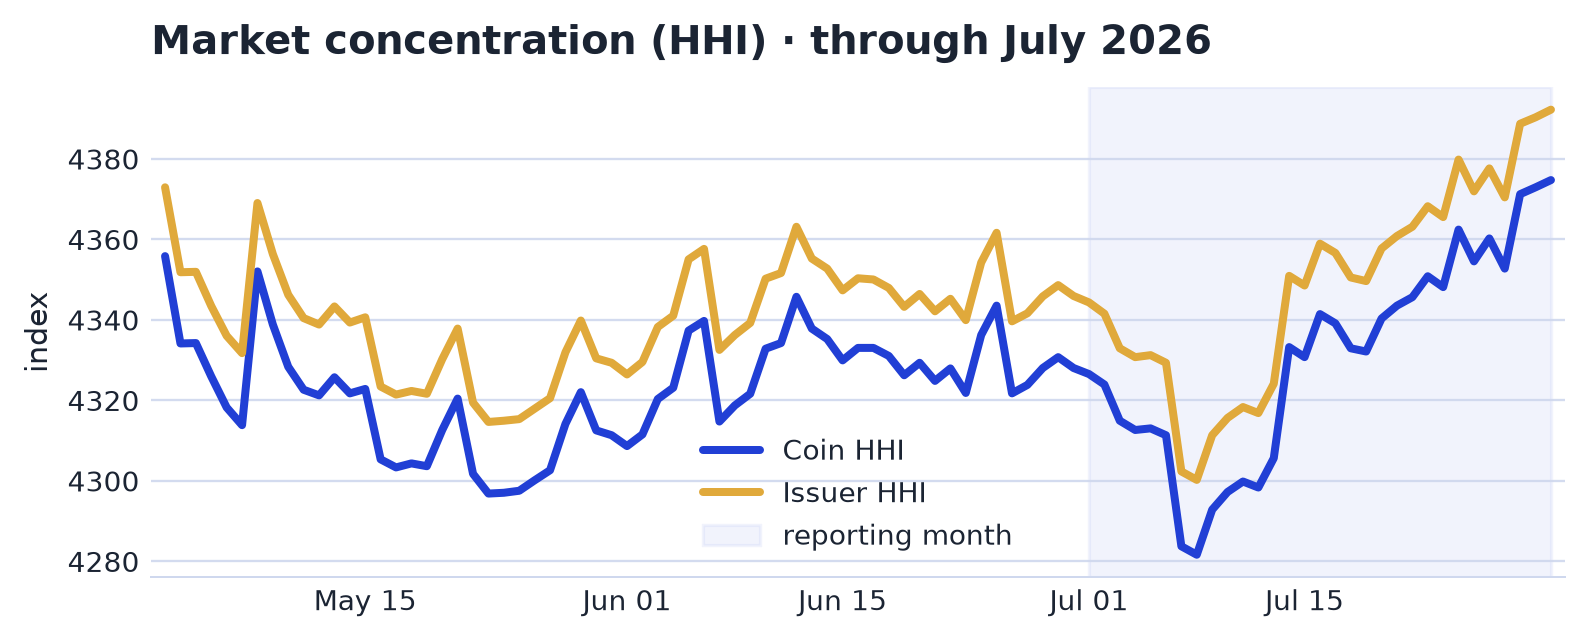
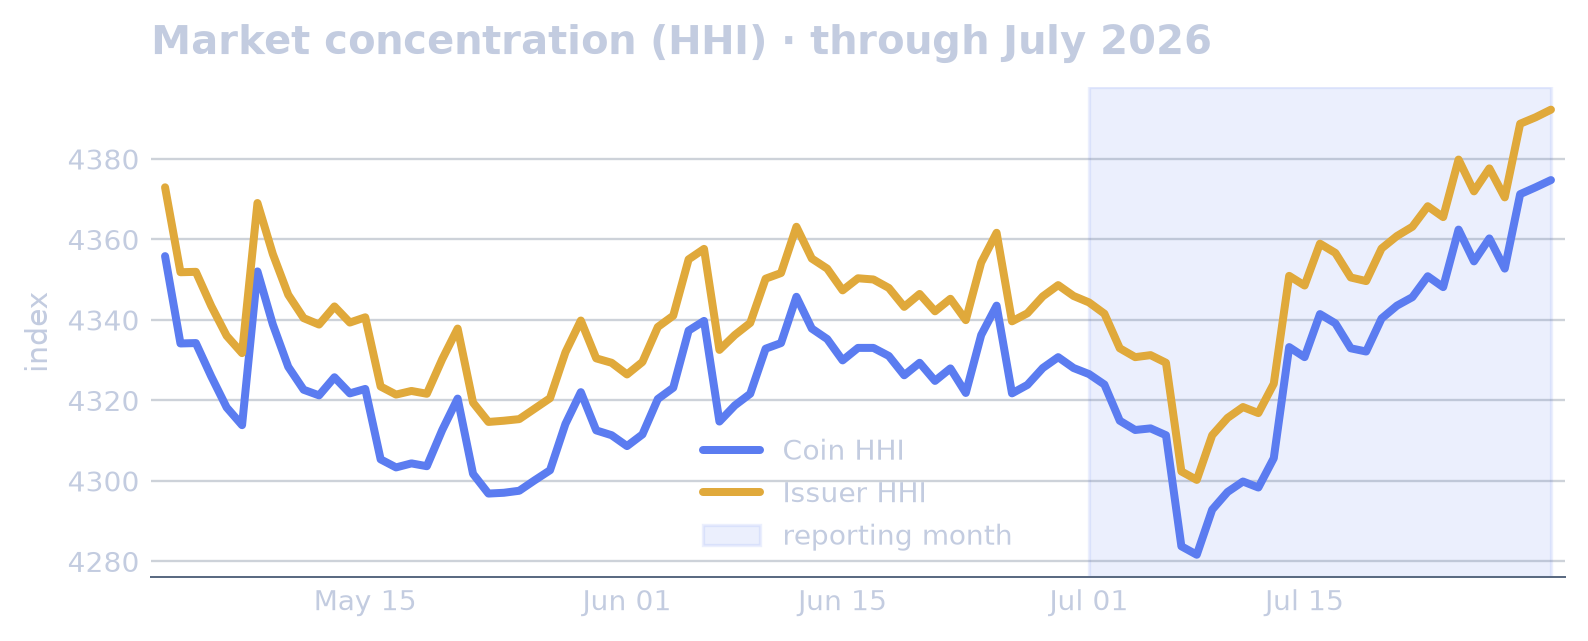
Market concentration rose in July. The market HHI increased from 4,326 to 4,375, a 1.11% gain, extending its rise for a second consecutive month. The issuer HHI moved in parallel, from 4,344 to 4,392, up 1.10% and also higher for a second consecutive month. The issuer Theil index stood at 3.86 at both the start and end of the month, with the underlying measure up 0.20%, likewise rising for a second consecutive month.
The Theil reading required a cautious interpretation, as the number of tracked stablecoins increased from 280 to 286 during the month. That change introduced a mechanical small-coin coverage component into the Theil increase, while the HHI measures provided the clearer concentration signal.
Within the month, the issuer Theil index recorded two related 10 July anomalies: a 1.92% day-over-day increase equal to a 5.6σ reading, 5.6 times the series' typical variation over the baseline window, followed by a 1.68% day-over-day decline equal to a -4.9σ reading, 4.9 times the series' typical variation over the baseline window in the opposite direction. Across July, the issuer Theil index averaged 2.5σ above baseline, a 2.5σ reading, 2.5 times the series' typical variation over the baseline window.
Regulatory Compliance (GENIUS & MiCA)
| Coin | Start of month | End of month | Change |
|---|---|---|---|
| USDC | $73.31B | $71.81B | -2.0% |
| PYUSD | $2.71B | $2.68B | -0.9% |
| USAT | $187M | $185M | -1.0% |
| USDP | $32M | $32M | -0.0% |
| Coin | Start of month | End of month | Change |
|---|---|---|---|
| USDC | $73.31B | $71.81B | -2.0% |
| EURC | $435M | $445M | +2.2% |
| EURCV | $141M | $154M | +9.1% |
| EURI | $36M | $38M | +5.2% |
| EURE | $31M | $32M | +5.3% |
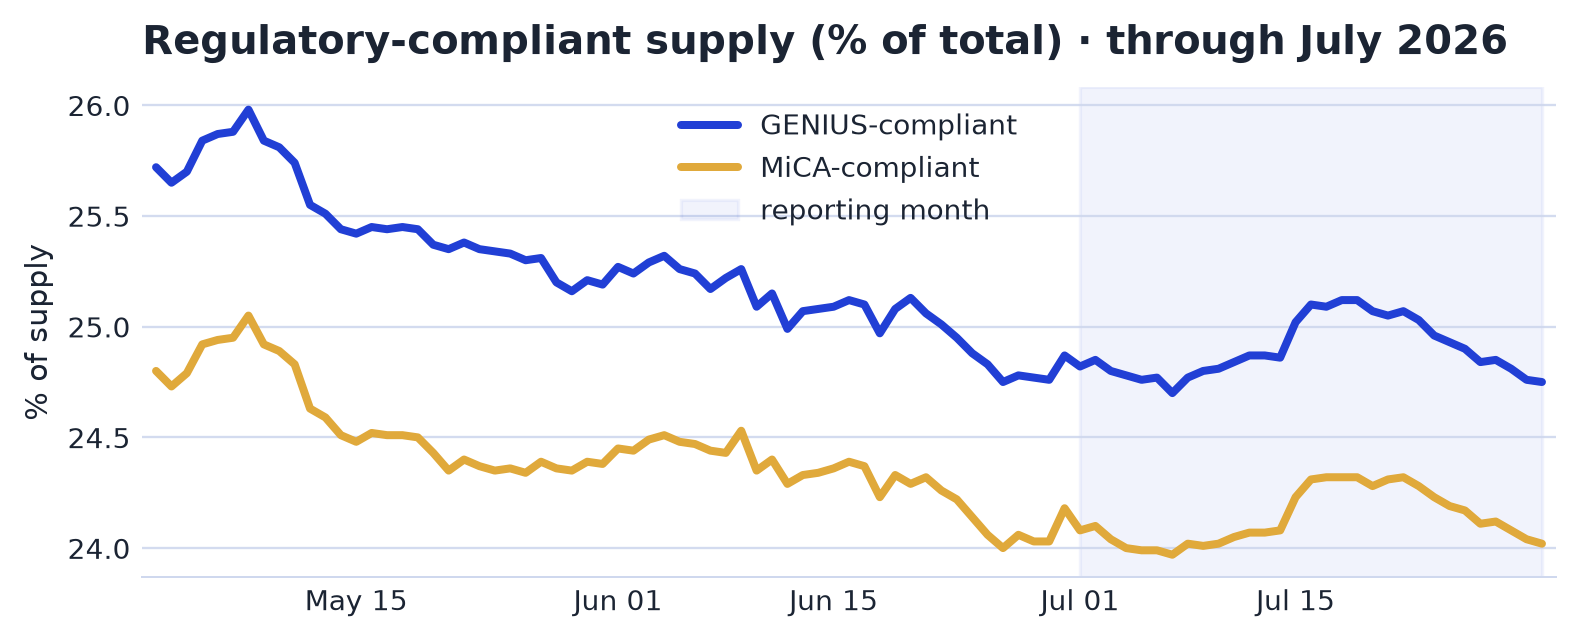
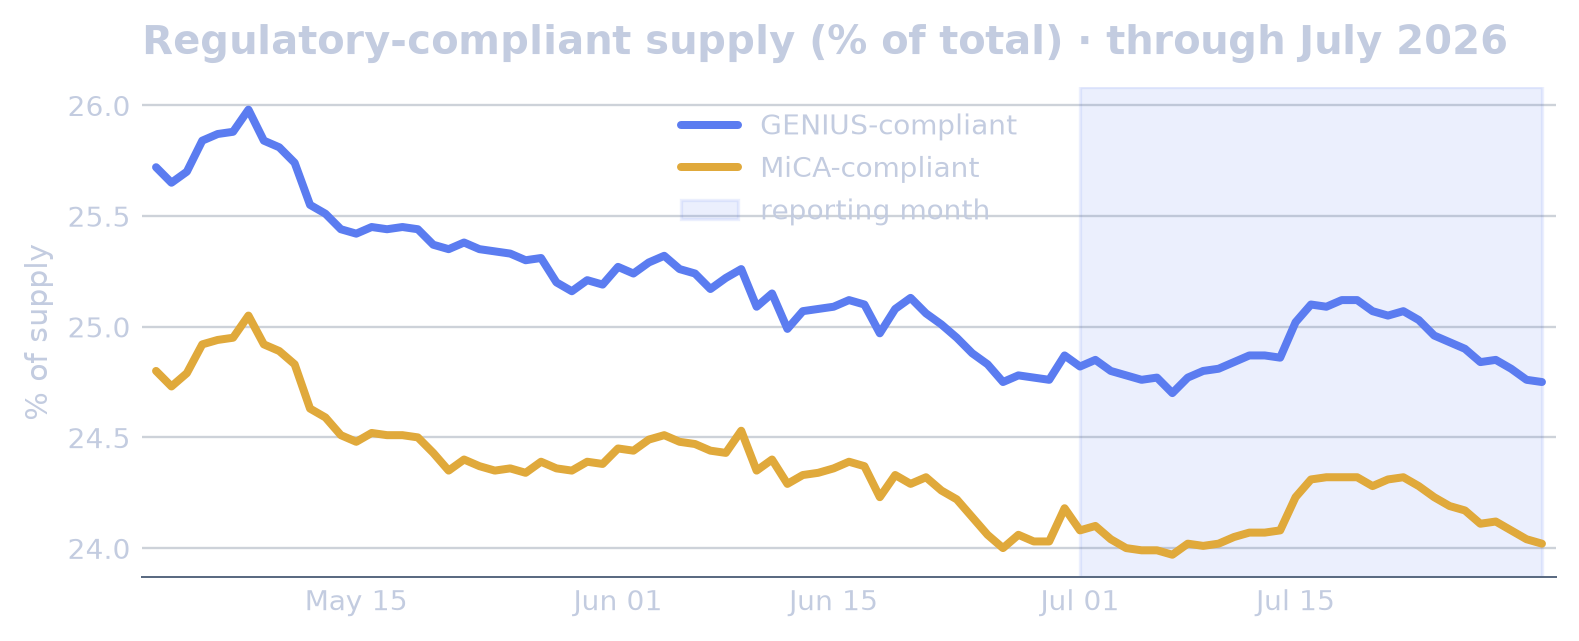
At end-July, GENIUS Act-compliant stablecoin supply stood at $74.71B, or 25% of total supply, while MiCA-compliant supply stood at $72.52B, or 24%. The two covered pools overlapped heavily through USDC, which dominated both regimes, so the compliant footprint remained well below the arithmetic sum of the two headline amounts. USDT, the largest stablecoin, sat outside both frameworks, leaving most market supply beyond GENIUS and MiCA coverage.
Regulatory headlines spanned several jurisdictions during the month. Taiwan’s legislature passed crypto and stablecoin regulations, while India’s central bank revived a push to isolate banks from crypto. In Europe, Decta said MiCA-compliant euro stablecoins had grown 128% before the MiCA transition ended, and officials were set to revise MiCA to cover non-EU stablecoin issuers.
US regulatory and enforcement news centred on sanctions, banking permissions and issuer status. OFAC sanctioned 134 ISIS-K crypto wallet addresses as Tether froze funds, and USDC issuer Circle won final approval for a US national trust bank charter. In Asia, the Bank of Korea stood firm on a bank-led stablecoin push as deposit token pilots advanced, while a separate Crypto Biz item described how stablecoins found their niche.
Peg Currency & Dollarisation
| Segment | End of month | % of total | Avg (month) | vs prev month |
|---|---|---|---|---|
| USD | $297.46B | 98.5% | $299.69B | ▼ -1.4% |
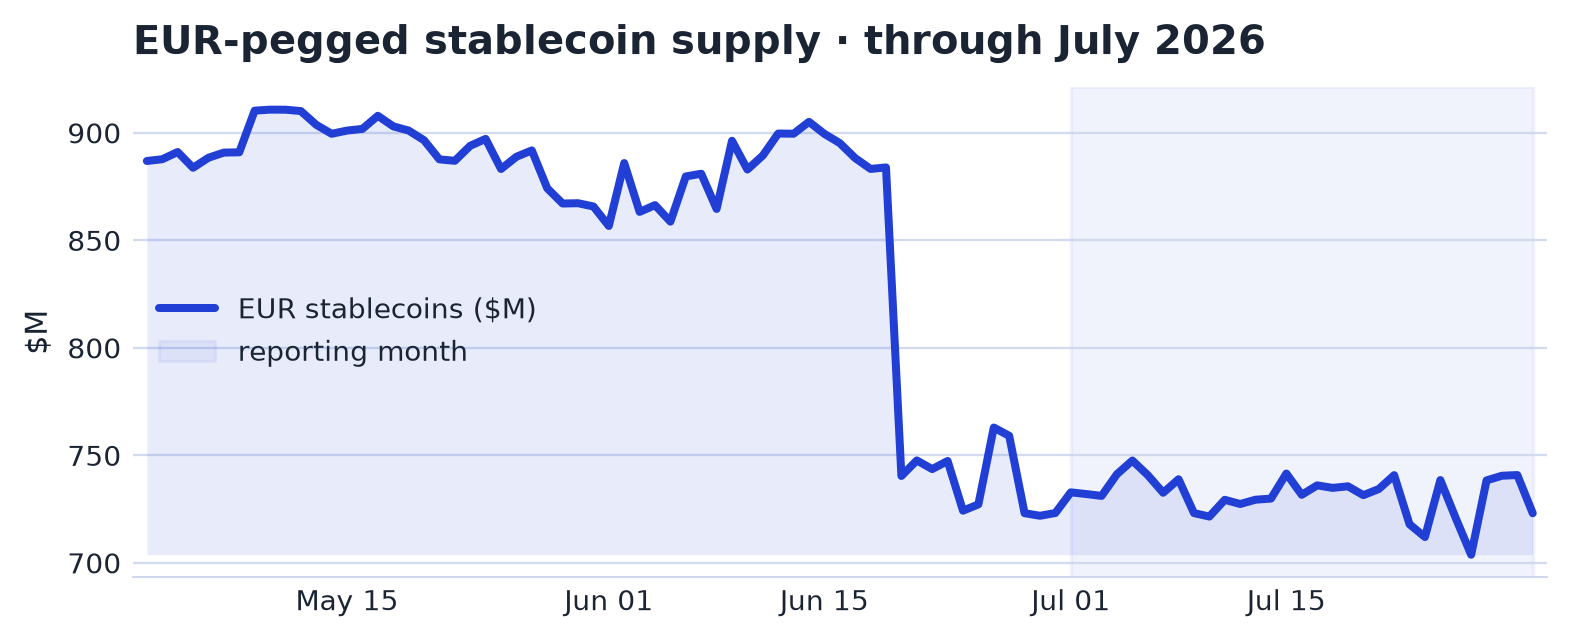
| EUR | $723M | 0.2% | $732M | ▼ -11.9% |
| GBP | $35M | 0.0% | $34M | ▲ +5.3% |
| CHF | $47M | 0.0% | $47M | ▲ +3.7% |
| JPY | $207M | 0.1% | $74M | ▲ +106.8% |
| SGD | $12M | 0.0% | $12M | ▼ -9.0% |
Stablecoin supply in July remained overwhelmingly dollar-denominated. USD-pegged tokens accounted for 98.5% of all supply at month-end, leaving peg-currency diversification confined to a small non-USD tail.
The euro led that tail. EUR-pegged supply stood at $723M, the largest non-USD peg, with MiCA-compliant euro coins driving its position. Other currency pegs, including GBP, CHF and JPY, were still nascent.
Backing & Collateral Types
| Segment | End of month | % of total | Avg (month) | vs prev month |
|---|---|---|---|---|
| Fiat-backed | $286.52B | 94.9% | $288.80B | ▼ -1.7% |
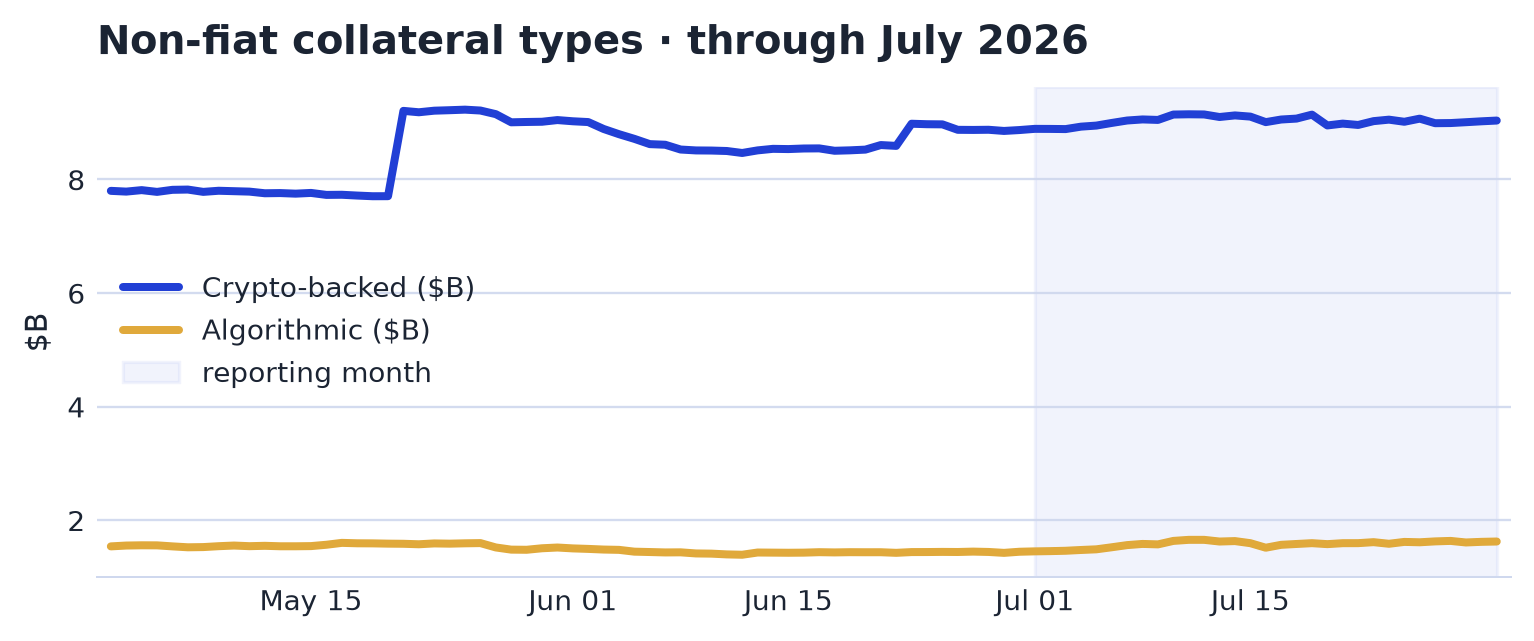
| Crypto-backed | $9.04B | 3.0% | $9.03B | ▲ +3.8% |
| Algorithmic | $1.62B | 0.5% | $1.58B | ▲ +9.7% |
| US Treasury-backed | $2.15B | 0.7% | $2.18B | → -0.2% |
Fiat-backed stablecoins stood at $286.52B at end-July, accounting for 94.9% of supply and leaving the market concentrated in conventional reserve models. Crypto-backed stablecoins accounted for $9.04B, or 3.0% of supply, while algorithmic stablecoins stood at $1.62B, or 0.5%. US Treasury-backed stablecoins were smaller still at $2.15B, representing 0.7% of supply.
The smaller crypto-backed and algorithmic segments remained the relevant tail of the collateral structure, even as fiat-backed issuance dominated the aggregate. Backing categories were measured independently and may overlap or use slightly different snapshots, so they need not sum exactly to headline supply; the classification reflected reserve model, while reserve quality varied by issuer.
Peg Stability & Risk
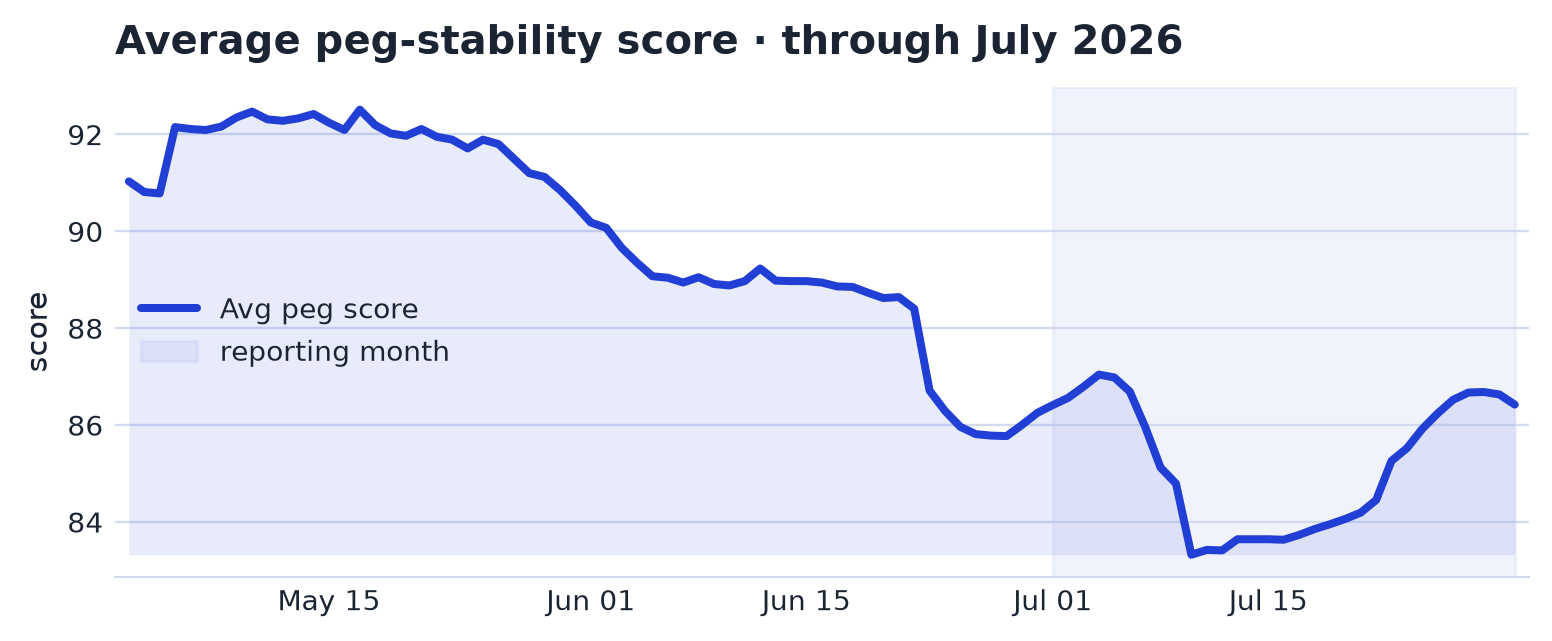
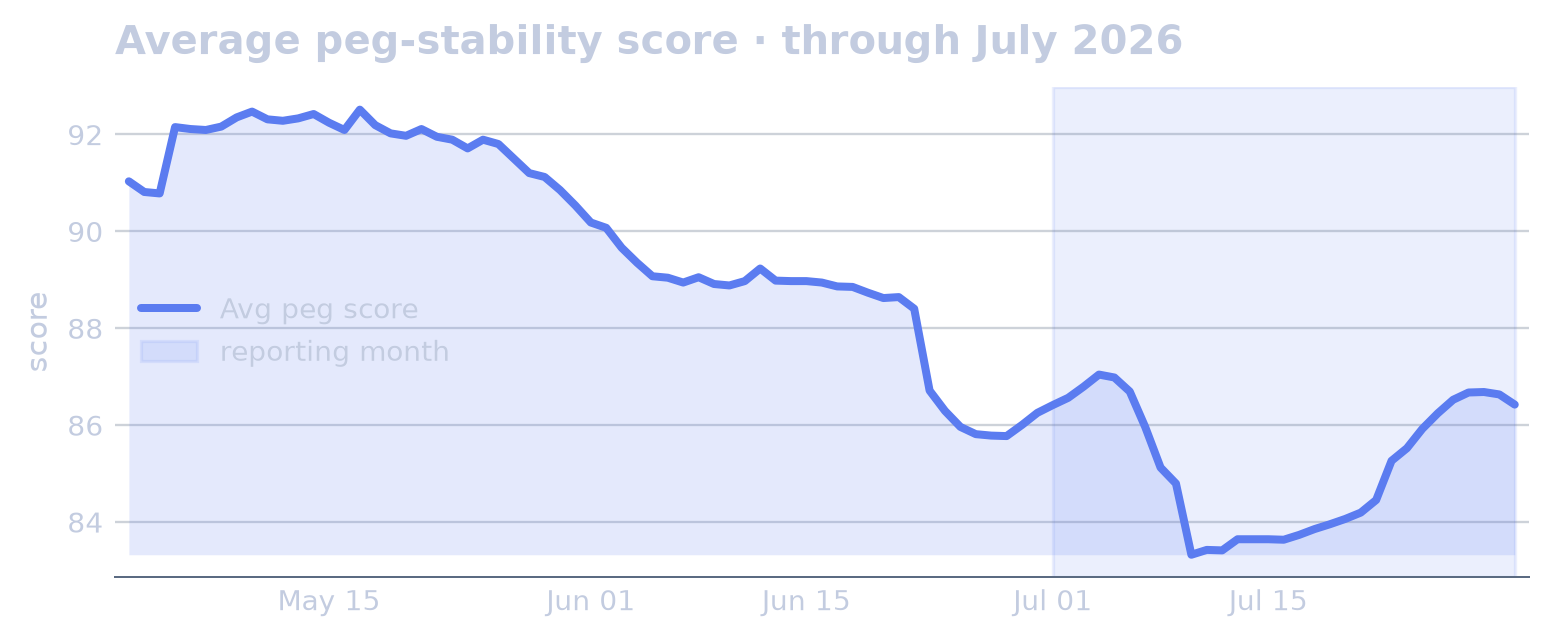
For dollar-pegged coins, the average peg score, a 0-100 stability score in which 100 meant holding $1.00 all month and lower readings reflected drift and off-peg days, stood at 86.4 at the start of July and 86.4 at month-end, up 0.01%. Euro- and other-currency stablecoins sat outside this measure because they required an FX reference. Beneath the flat aggregate score, coins off-peg rose from 2 to 4, reversing June 2026’s decline, while the worst deviation fell from 1.13% to 1.00%, down 11.89% and lower for a second consecutive month. The 30-day depeg count declined from 74 to 67, reversing June 2026’s rise.
The month’s peg events were concentrated in price spikes and a mid-month deterioration in aggregate stability measures. USDGO, a dollar stablecoin, reached its highest level since 2026-06-26 on 2026-07-01. The average peg-stability score then fell 1.73% day over day on 2026-07-10, a -3.0σ reading, three times the series’ typical variation over the baseline window, before the maximum depeg deviation exceeded 0.50% on 2026-07-11, with a peak of 53.00%. The 30-day depeg count peaked at 77 on 2026-07-16.
USDG, a dollar stablecoin, recorded the clearest single-token price anomaly: on 2026-07-17 it traded at 1.0070, 0.70% off peg, its highest level since 2025-04-09. By 2026-07-31, coins off-peg had peaked at 4, matching the month-end count.
Trading Activity & Turnover
| Coin | Market cap | 24h volume | Turnover |
|---|---|---|---|
| USDT | $183.61B | $43.49B | 24% |
| USD1 | $4.00B | $771M | 19% |
| USDC | $71.81B | $10.82B | 15% |
| U | $1.10B | $117M | 11% |
| RLUSD | $1.59B | $151M | 9% |
| PYUSD | $2.68B | $192M | 7% |
| USDG | $3.36B | $238M | 7% |
| USDD | $1.57B | $104M | 7% |
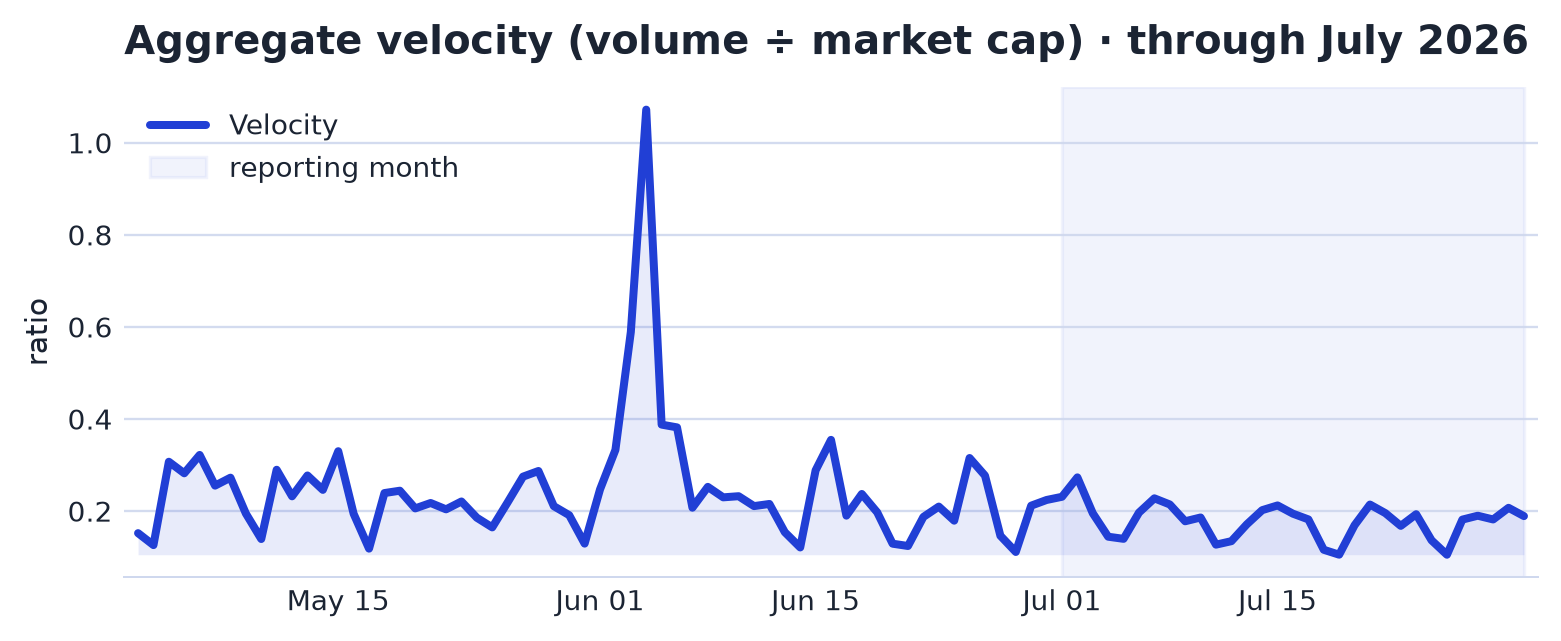
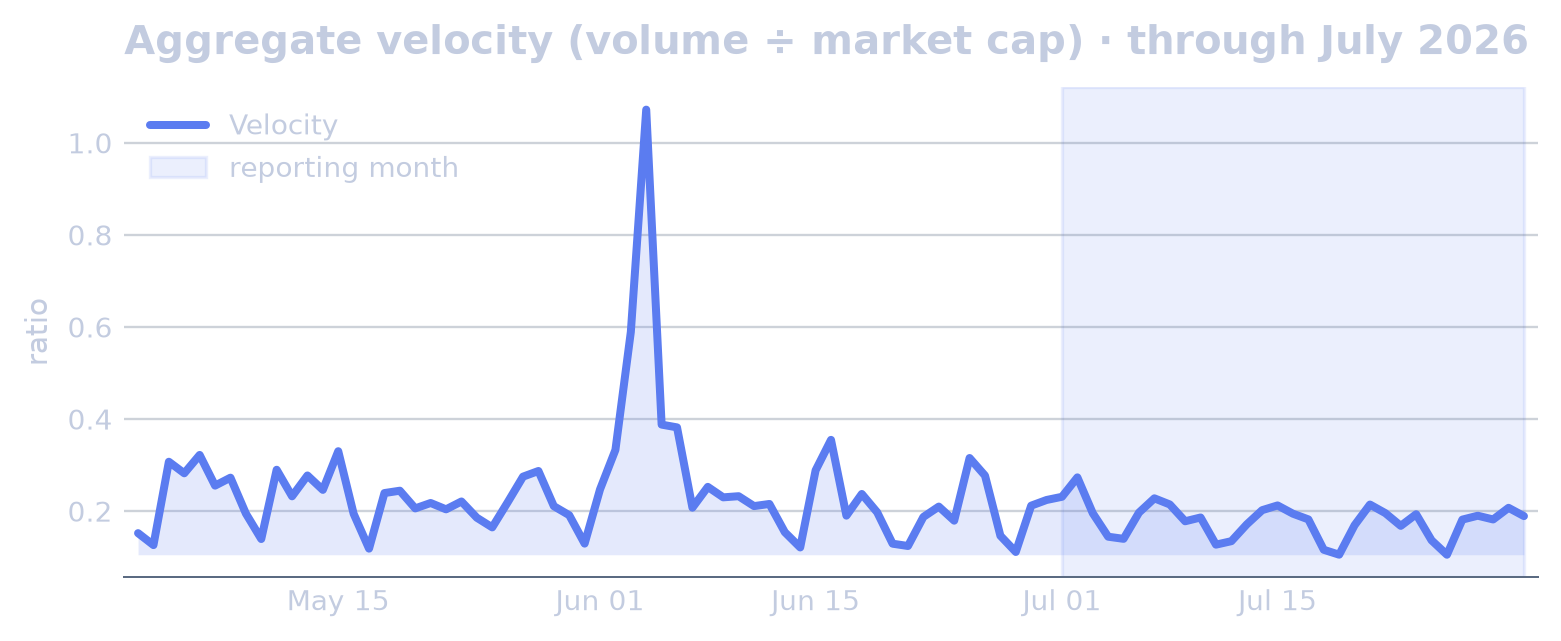
At end-July, aggregate velocity, measured as 24-hour trading volume divided by market capitalisation, stood at 0.1886, above the ~0.15 benchmark and consistent with elevated trading turnover.
Network Distribution
| Network | End of month | Avg (month) | Range (min – max) | vs prev month |
|---|---|---|---|---|
| Ethereum | $146.74B | $150.15B | $146.74B – $153.24B | ▼ -4.2% |
| Tron | $91.22B | $90.49B | $88.85B – $91.49B | ▲ +1.3% |
| Solana | $15.63B | $15.26B | $14.33B – $16.51B | ▲ +1.9% |
| BSC | $13.89B | $13.86B | $13.48B – $14.35B | → +0.2% |
| Hyperliquid L1 | $6.25B | $6.18B | $5.93B – $6.34B | ▼ -3.4% |
| Base | $4.74B | $4.80B | $4.71B – $4.91B | ▲ +1.3% |
| Arbitrum | $3.62B | $3.65B | $3.56B – $3.81B | ▼ -5.3% |
| Polygon | $3.09B | $3.30B | $3.09B – $3.41B | ▼ -4.5% |
| X Layer | $2.01B | $1.94B | $1.84B – $2.01B | ▲ +16.7% |
| Avalanche | $1.50B | $1.54B | $1.27B – $1.87B | ▲ +11.5% |
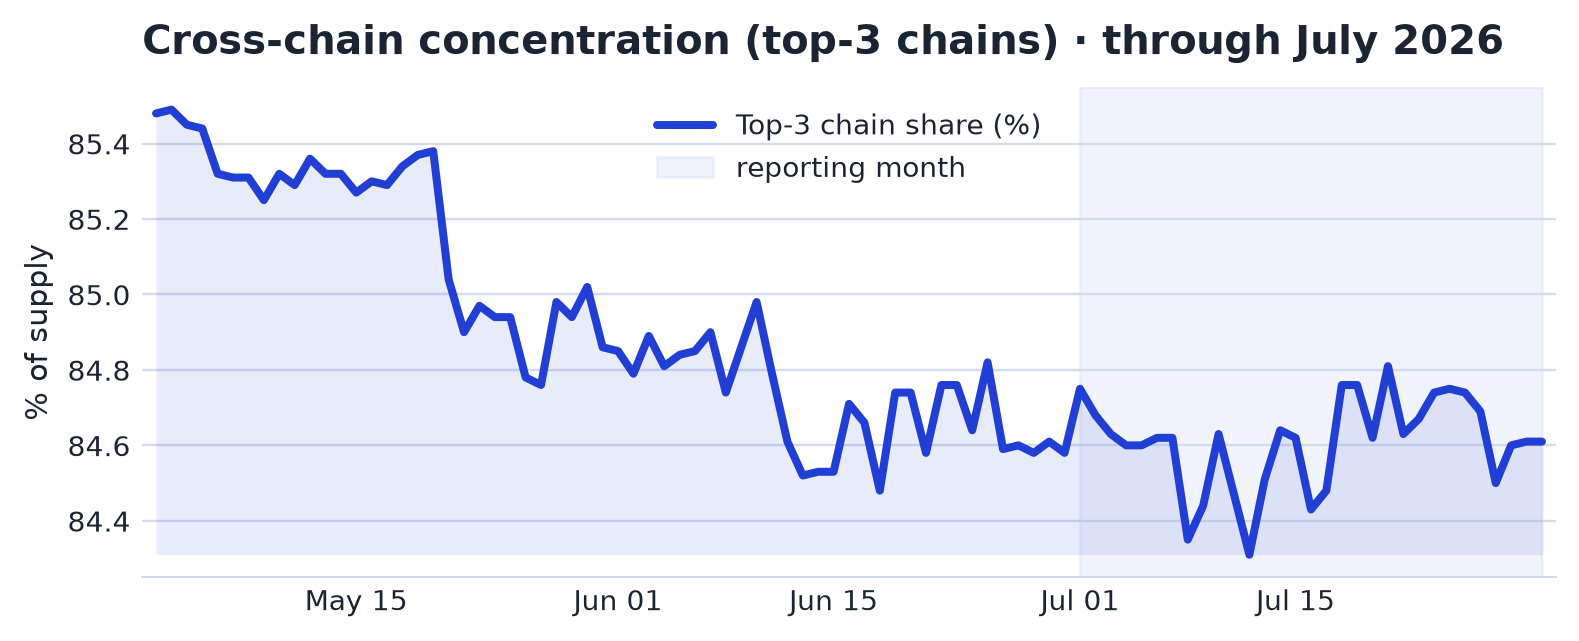
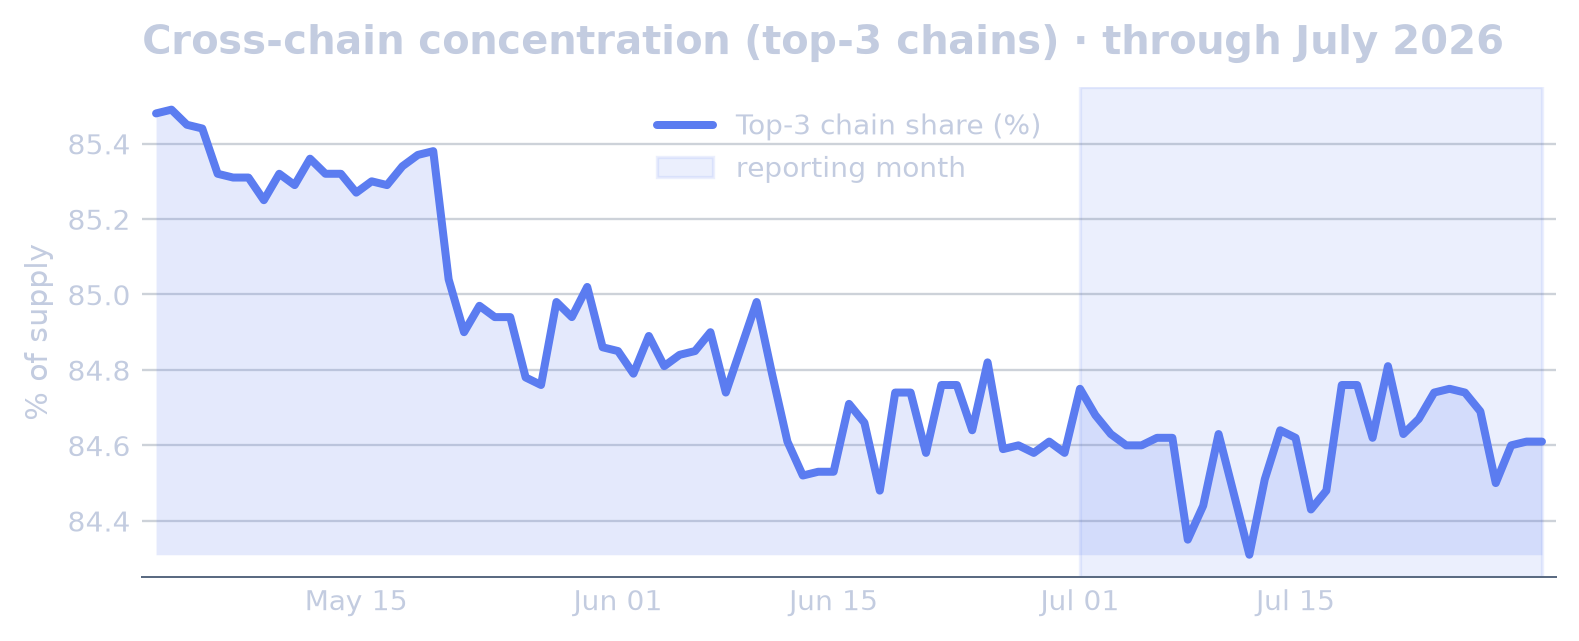
Stablecoin supply ended July concentrated across blockchains. The top three chains accounted for 84.6% of circulating supply, while the largest single chain held 49.0%. Cross-chain entropy stood at 2.25 bits, consistent with a distribution in which supply had spread beyond one venue but remained anchored in a small set of chains.
Yield-Bearing & Tokenized-Dollar Instruments
Yield-bearing and tokenized-dollar instruments stood at $13.63B at end-July, down $978M, or 6.7% month on month, across 86 tracked instruments. This adjacent segment remained outside stablecoin supply: yield-bearing wrappers such as sUSDe and sUSDS were staked forms of underlying stablecoins already counted in the headline total, so their value was a subset of that supply. Standalone tokenized-treasury tokens such as USDY were money-market-like instruments outside the stablecoin universe. The segment therefore represented adjacent capital reaching for yield. Tokenized commodity instruments, including gold, stood at $50M across 1 tracked instrument and were roughly unchanged month on month.
The largest line item was sUSDS, the staked USDS wrapper, at $4.62B after a $909M decline versus the previous month-end. USDY, Ondo US Dollar Yield, stood at $2.15B, down $9M, while sUSDe, Ethena’s staked USDe, ended the month at $1.55B after falling $121M. BFUSD stood at $1.32B, with a +$0M month-end change.
Among the other large wrappers, syrupUSDC fell $234M to $1.05B, and syrupUSDT declined $68M to $424M. The main increases in the listed instruments came from ONYC, OnRe Tokenized Reinsurance, which rose $41M to $247M, and Savings USDD, which increased $5M to $241M.
Cross-Currents
July’s net par-pegged supply change was -3.61B USD. The move was concentrated in a few products: USDC changed by -1.50B USD, USDT by -0.86B USD and USD1 by -0.64B USD, together accounting for 83% of the net move. This measure covered the par-pegged universe only, while the report’s headline total-supply change was measured on a broader instrument set.
Coverage broadened, but concentration still rose. Tracked par-pegged coins increased from 280 to 286, a +2% change, while the market HHI moved +1.11%. The additional coins were collectively too small to dilute incumbent shares.
GENIUS-compliant supply changed -2.0% over the month, compared with -1.2% for total par-pegged supply. The compliant cohort therefore underperformed the par-pegged market over July.
MiCA-compliant supply changed -1.9% over the month, also below the -1.2% change in total par-pegged supply. The relative move was one of underperformance against the broader par-pegged universe.
Peg instability measures did not move uniformly. Thirty-day depeg events changed -9.5%, while the average peg score changed +0.01% and the worst single deviation moved -11.9%. Frequency and severity of instability moved in different directions, leaving no single directional reading across the peg-stability indicators.
Macro & Crypto Backdrop
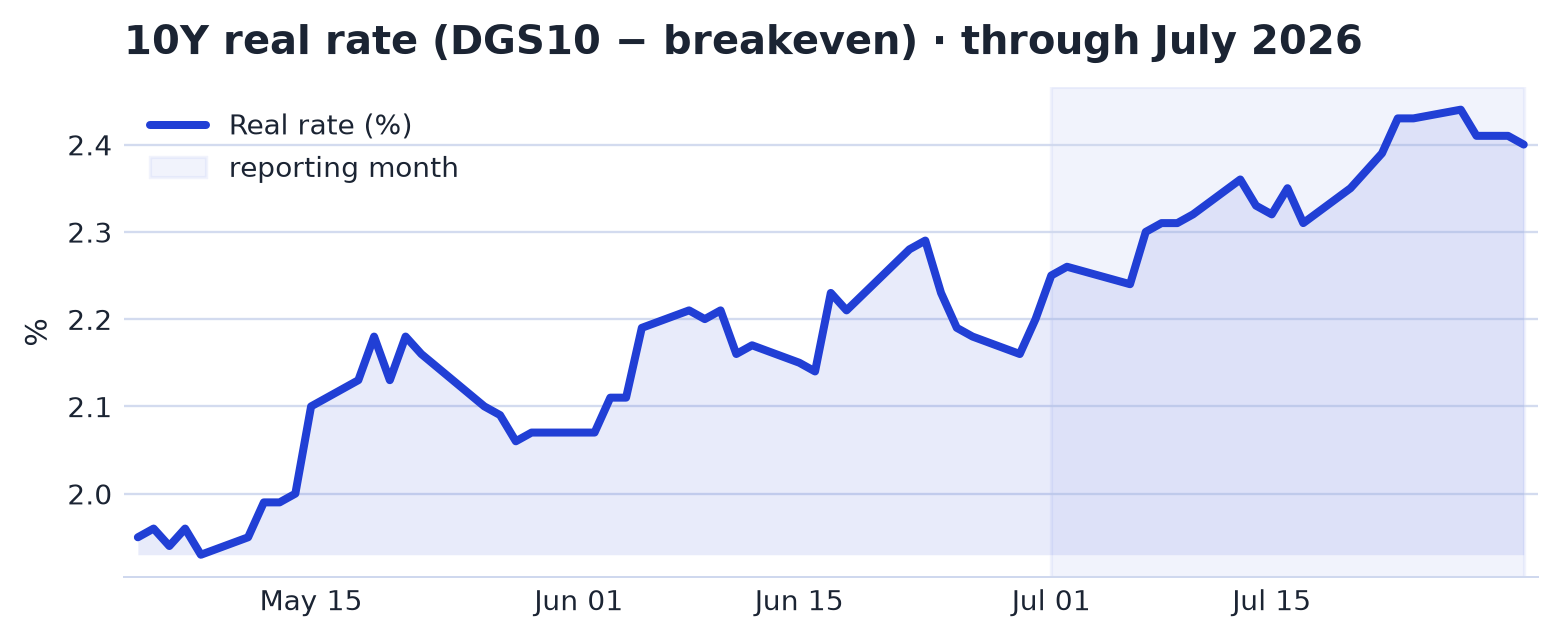
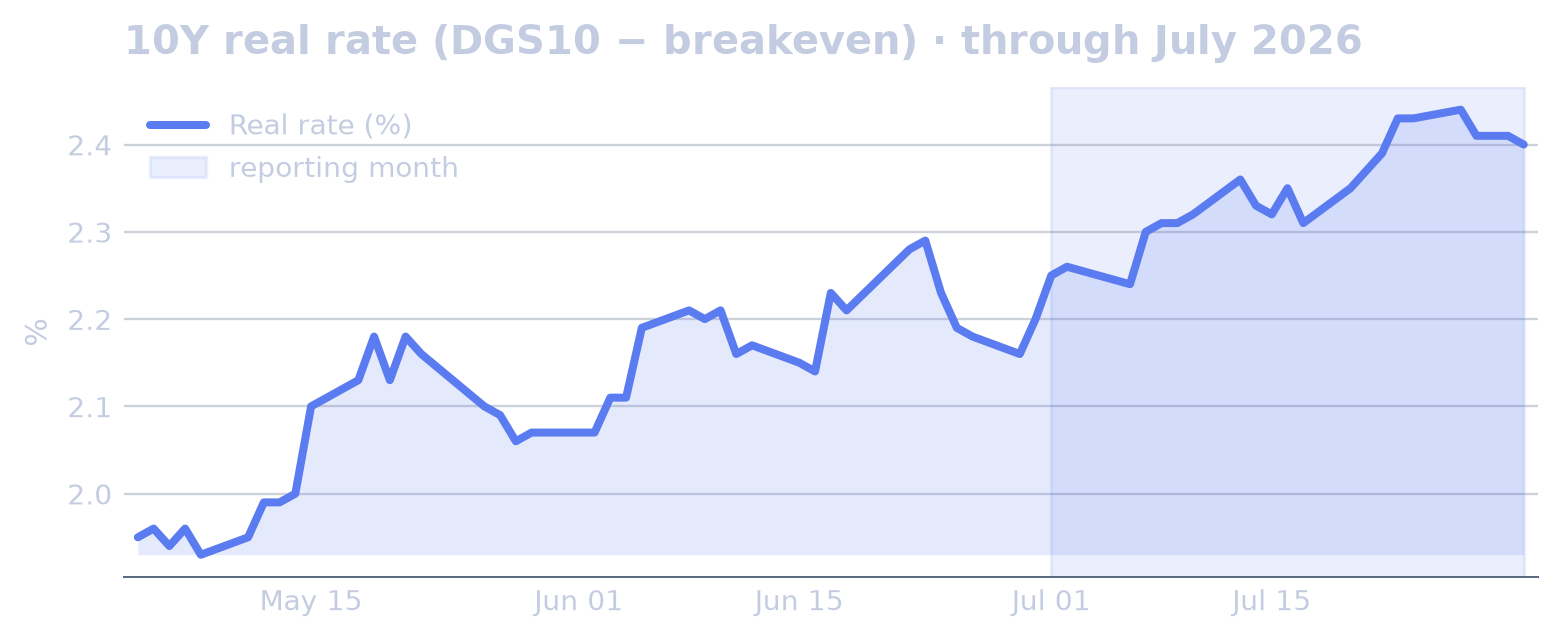
US rates ended July higher. The US 10-year yield rose from 4.48% to 4.68%, a 4.46% increase that reversed June’s decline, while the 10-year real rate rose from 2.25% to 2.40%, up 6.67% and higher for a third consecutive month. The broad dollar index began and ended at 121, a -0.36% move that reversed June’s rise. Risk measures also firmed, with the VIX rising from 16.59 to 17.09, up 3.01% for a second consecutive month.
Crypto conditions improved over the same period. Bitcoin rose from $59,790 to $62,476, a 4.49% gain that reversed June’s decline, while BTC dominance increased from 55.50% to 56.11%, up 1.10% and also reversing the prior month’s decline. Market sentiment recovered from depressed levels, with the Fear & Greed index rising from 11.00 to 25.00, a 127.27% increase that reversed June’s fall.
The main rate move was concentrated in the long end. The 2s10s yield curve rose 45.2% over the month, a 3.1σ move, 3.1 times the series’ typical 30-day move; the US 10-year yield accounted for 143% of that move, while the US 2-year yield offset 43% in the opposite direction. On 29 July, the curve rose 28.57% day over day, a 6.2σ move, 6.2 times the series’ typical variation over the baseline window, with the US 10-year yield accounting for 60% of the move and the US 2-year yield 40%. The 10-year real rate had a month mean 3.3σ above baseline, 3.3 times the series’ typical variation over the baseline window; the US 10-year yield accounted for 133% of the move, while 10-year breakeven inflation offset 33% in the opposite direction. The US 10-year yield itself had a month mean 2.2σ above baseline, 2.2 times the series’ typical variation over the baseline window. In Europe, the euro short-term rate and the ECB deposit facility rate each had month means 5.0σ above baseline, five times each series’ typical variation over the baseline window.
The macro headlines centred on the Federal Reserve holding rates while high prices remained prominent, and on an escalating US-Iran conflict around the Strait of Hormuz. Those threads coincided with higher nominal and real US yields, elevated European rate measures, and a second monthly rise in the VIX. The broad dollar index was little changed, while Bitcoin and crypto sentiment both recovered from June’s declines.