June 2026 Stablecoin Market Report
Total stablecoin supply stood at $309.66B at the start of June and ended at $303.11B, a decline of 2.12%, falling for a second consecutive month. USDT’s share edged up from 57.8% to 58.0%, a gain of 0.2pp, while USDC’s share slipped from 23.4% to 23.1%, down 0.3pp. The contractio
All levels as of 30 Jun 2026 · changes vs 31 May 2026
This Month
News & Developments
Regulatory developments led June, with the Bank of England easing stablecoin rules and introducing a 40B pound issuance cap, while US regulators pushed user ID requirements for issuers. Institutional activity focused on settlement and distribution, with Mastercard expanding card settlement hours via stablecoins, Visa testing private stablecoin settlement with Brale on Canton, and Coinbase appearing in both reserve-asset and stablecoin-rail initiatives.
Regulation & Policy
Regulatory attention centred on supervision, identity controls and reserve design, with New York and EU finance watchdogs teaming up to police stablecoins and New York separately aiming to keep stablecoin issuers while leaning on a federal rulebook. In the US, regulators pushed user ID requirements for stablecoin issuers akin to regulated banks. In the UK, the Lords warned that Bank of England rules could regulate pound stablecoins into irrelevance before the BoE eased its approach and introduced a 40B pound issuance cap. BIS publications covered design choices, finding that rigid reserve rules can increase default risk, mapping stablecoin yield models and later warning that stablecoins risk fragmenting the global financial system; OpenPayd secured a MiCA licence in Europe.
Issuance & Launches
AllUnity debuted SEKAU, a fully reserved Swedish krona stablecoin.
Adoption & Partnerships
Payments and settlement initiatives included Mastercard expanding card settlement hours via stablecoins and Visa testing private stablecoin settlement with Brale on Canton. Coinbase invested in a ProShares ETF tailored for stablecoin reserve assets, and Spiko linked EU-regulated T-bill funds to Coinbase stablecoin rails. In consumer and cross-border payments, Zelle launched stablecoin ZLUSD with app payments to India planned by end-2026, MassPay tapped Coinbase to expand stablecoin payouts, and the IMF urged Nigeria to take action over rising stablecoin cross-border payments. Nuvei moved to buy Payoneer for $2.75bn, combining stablecoin receipts and payouts, while Circle and Nomura eyed Japan corporate FX with stablecoin settlement and credit unions managing $25B in assets joined a stablecoin infrastructure program.
The Market
Market Structure & Supply
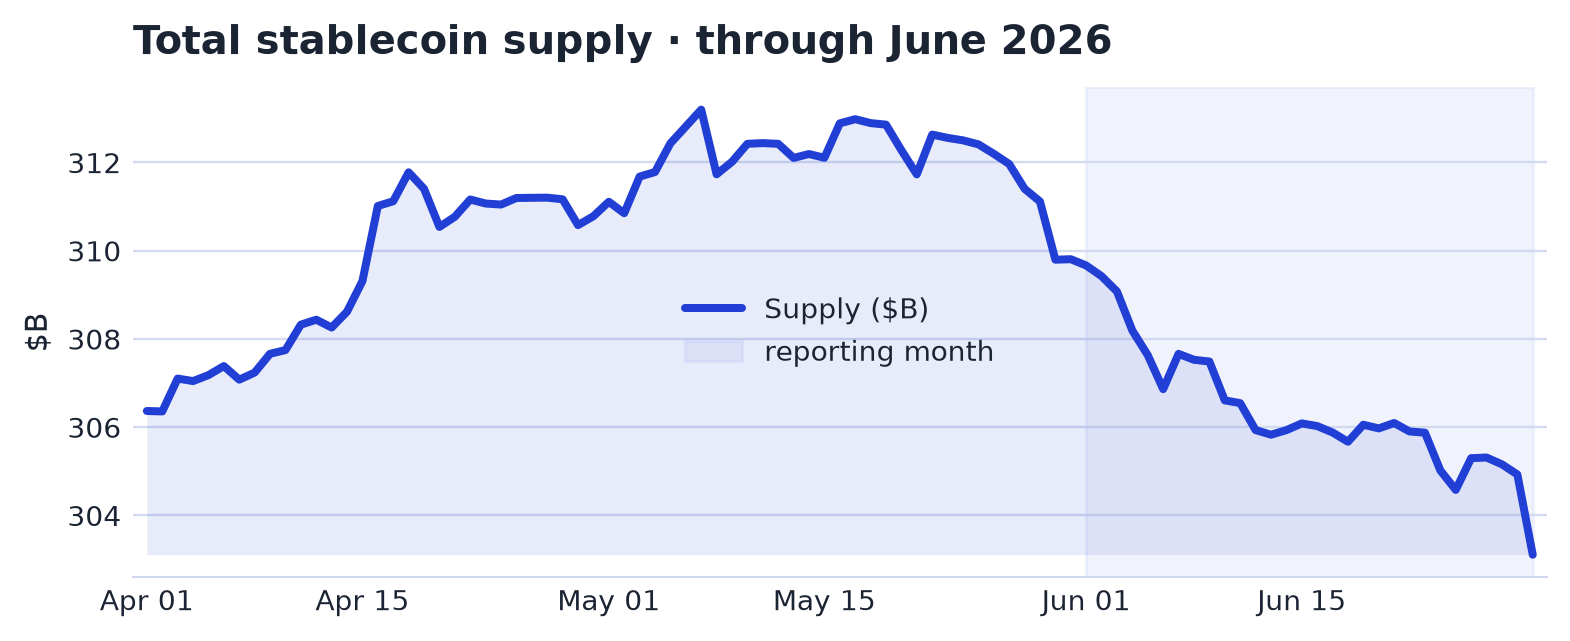
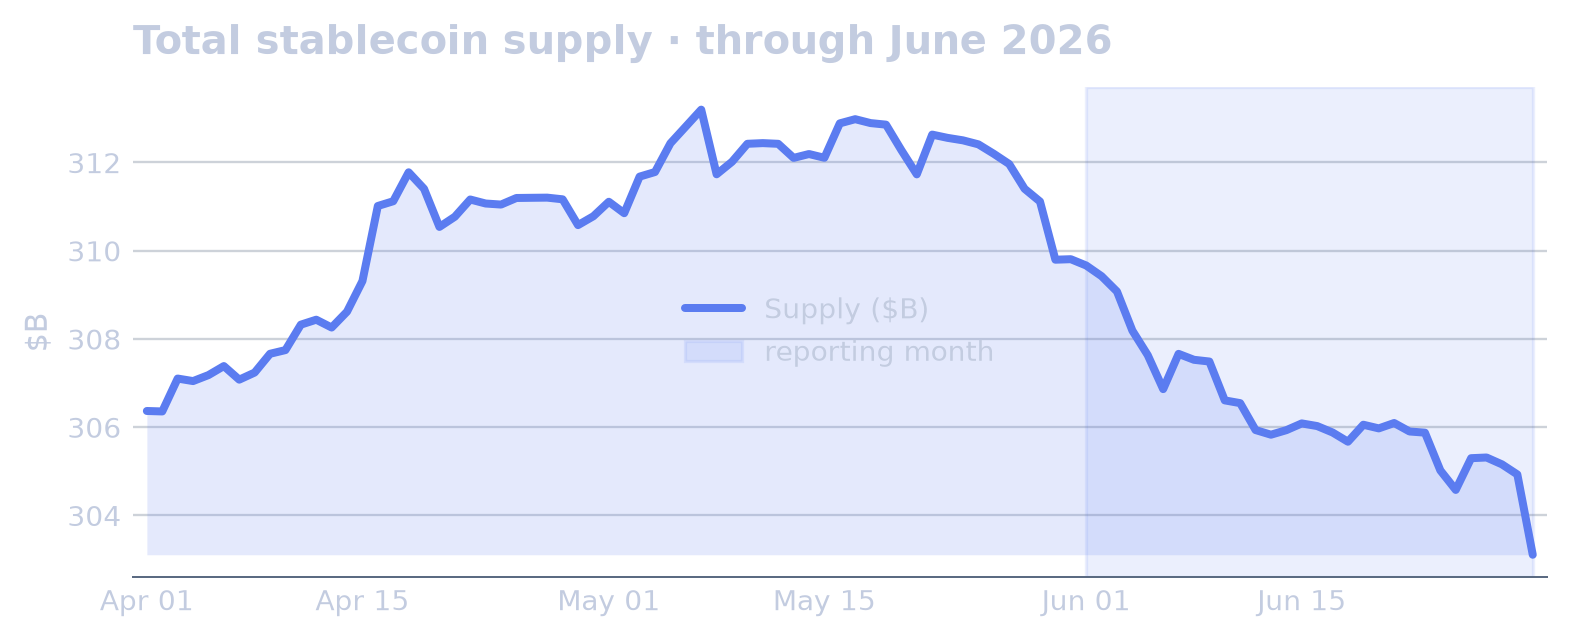
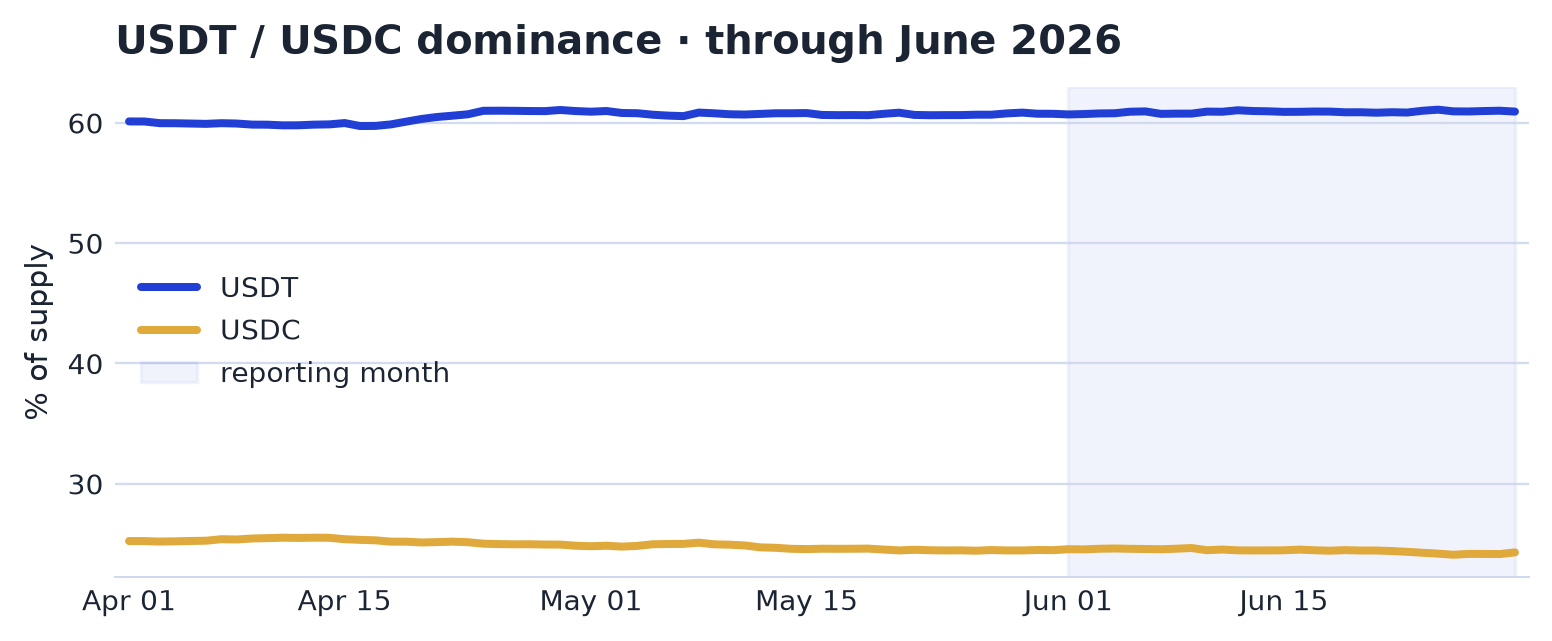
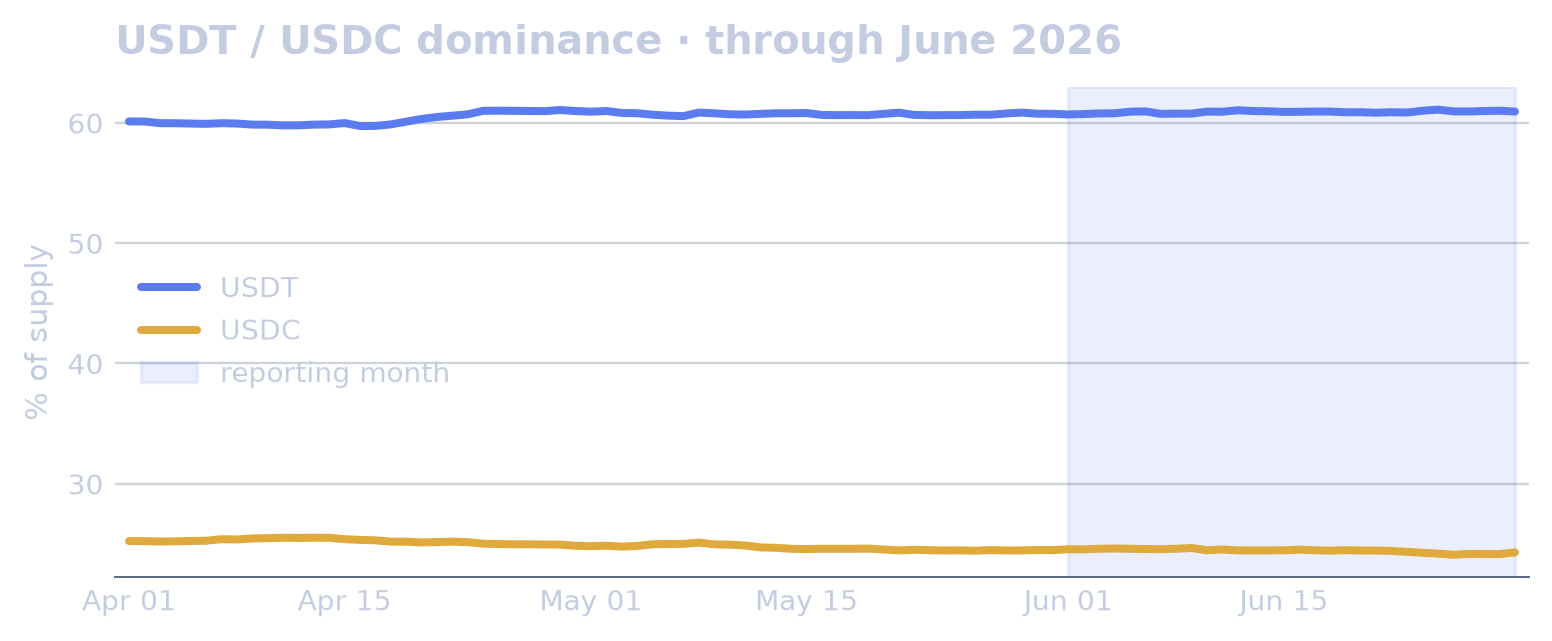
Total stablecoin supply stood at $309.66B at the start of June and ended at $303.11B, a decline of 2.12%, falling for a second consecutive month. USDT’s share edged up from 57.8% to 58.0%, a gain of 0.2pp, while USDC’s share slipped from 23.4% to 23.1%, down 0.3pp. The contraction in aggregate supply coincided with the 30-day supply growth rate reaching its lowest point in the data since 2025-05-09 on 2026-06-25.
The largest monthly declines among tracked coins with market capitalisation above $1B were concentrated in smaller and mid-sized stablecoins. RLUSD, Ripple’s dollar stablecoin, fell 17.0% over the month to $1.41B, including a 9.90% day-over-day drop on 2026-06-30, a 4.7σ move. USDF, a bank-issued dollar stablecoin, declined 14.8% to $1.42B; PYUSD, PayPal USD, fell 11.3% to $2.69B; and USDS, the Sky Protocol dollar, declined 9.2% to $10.03B.
The positive outliers were USDG, the Global Dollar Network stablecoin, which rose 12.3% over the month to $2.97B, and DAI, the MakerDAO dollar, which gained 5.8% to $4.62B. DAI’s move included an 8.82% day-over-day increase on 2026-06-23, a 5.6σ change. Among the largest issuers, USDC’s market capitalisation fell 3.2% to $73.62B, while USDT recorded a 0.72% day-over-day decline on 2026-06-30, a 5.5σ move. USDD, the Tron DAO dollar, ended down 3.4% at $1.37B.
Concentration & Competition
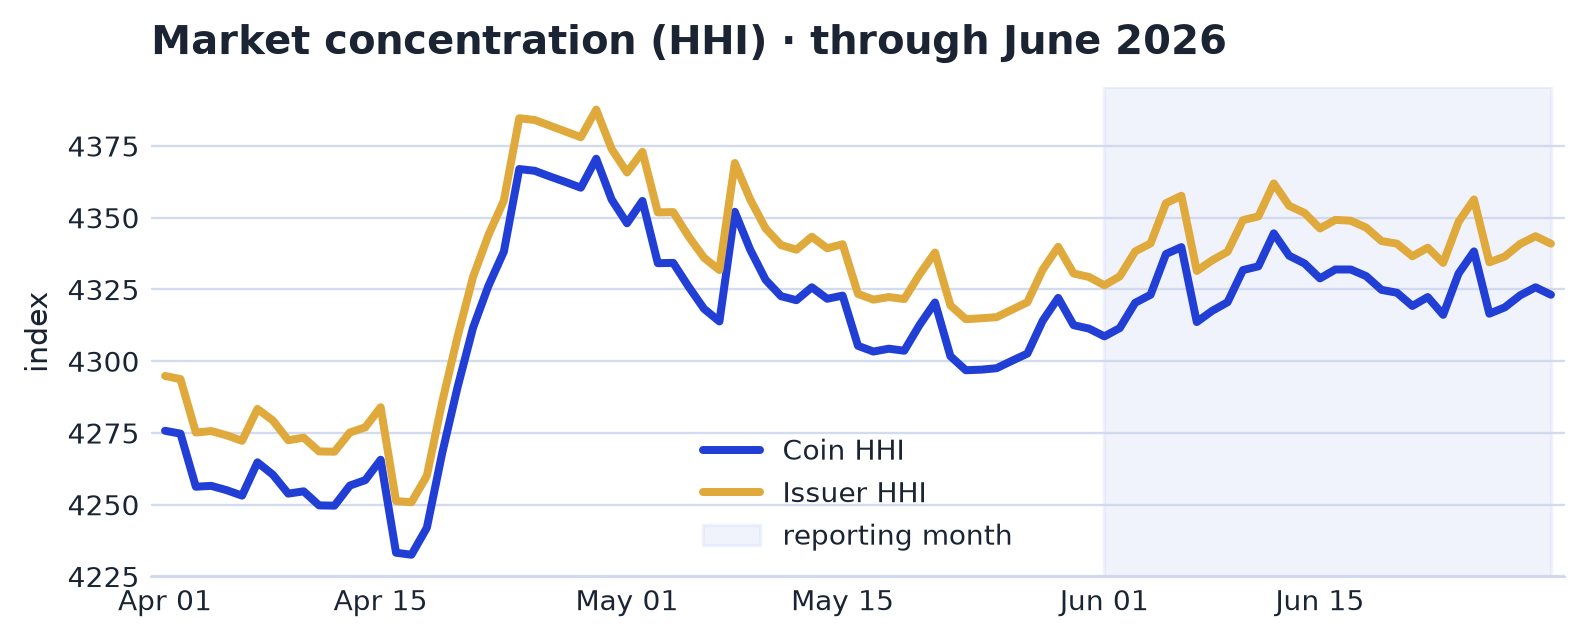
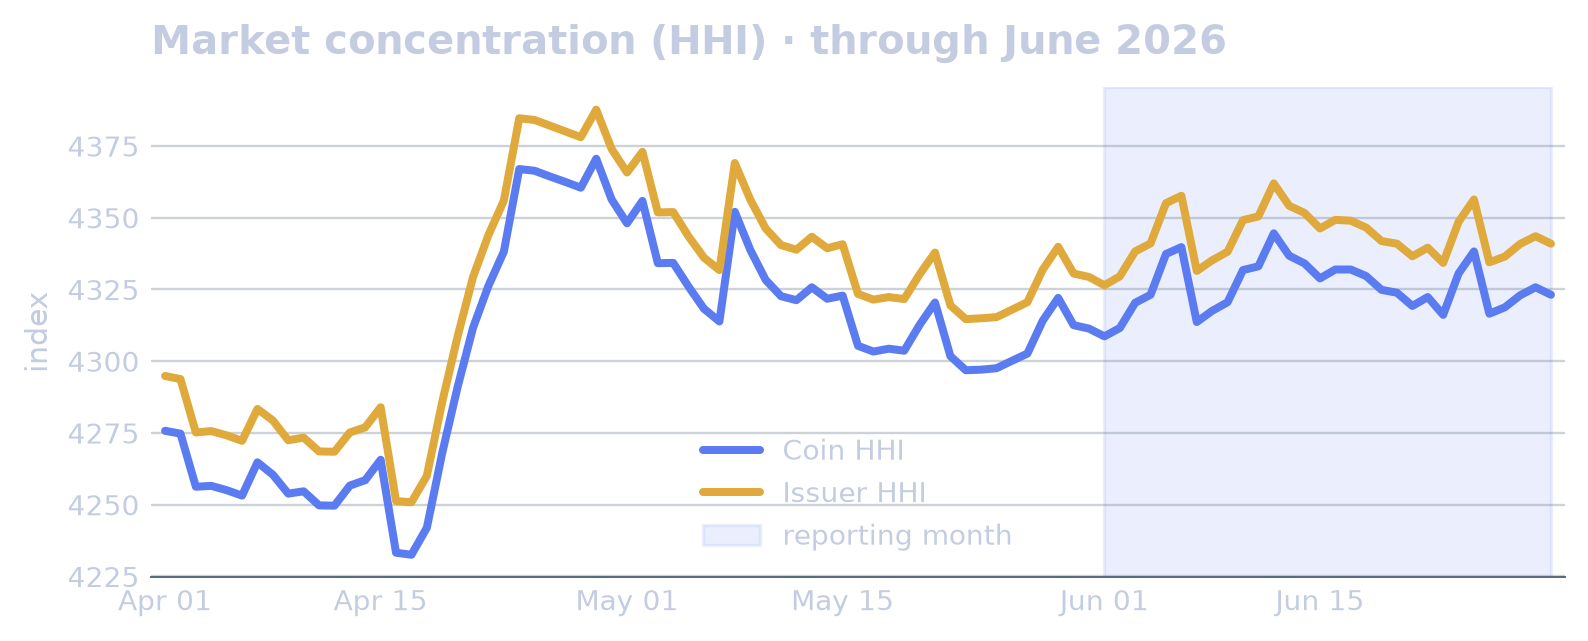
Concentration edged higher in June. Market HHI rose from 4,309 to 4,323, a 0.34% increase, reversing May’s decline. Issuer HHI moved in parallel, rising from 4,326 to 4,341, also up 0.34% and reversing May’s decline. The issuer Theil index rose more visibly, from 3.69 to 3.83, a 3.94% increase, but coverage affected that reading: the tracked stablecoin set expanded from 187 to 279, and the inclusion of more small coins mechanically lifted the Theil measure.
The Theil move was large relative to its own history. The issuer Theil index rose 3.9% over the month, a 3.6σ move versus a typical 30-day change, with realised volatility running at 2.4x its baseline. The sharpest single-day move occurred on 7 June, when the index rose 3.62% day over day, a 12.8σ change. By 12 June it had reached its highest level in the data since 2025-04-09, and its month mean stood 3.4σ above baseline.
Composition
Regulatory Compliance (GENIUS & MiCA)
| Coin | Start of month | End of month | Change |
|---|---|---|---|
| USDC | $76.03B | $73.62B | -3.2% |
| PYUSD | $3.03B | $2.69B | -11.3% |
| USAT | $157M | $187M | +19.0% |
| USDP | $32M | $32M | -0.1% |
| FUSD | $10M | $11M | +7.3% |
| Coin | Start of month | End of month | Change |
|---|---|---|---|
| USDC | $76.03B | $73.62B | -3.2% |
| EURC | $429M | $438M | +2.2% |
| EURCV | $123M | $141M | +14.4% |
| EURI | $58M | $36M | -36.9% |
| EURE | $29M | $30M | +3.1% |
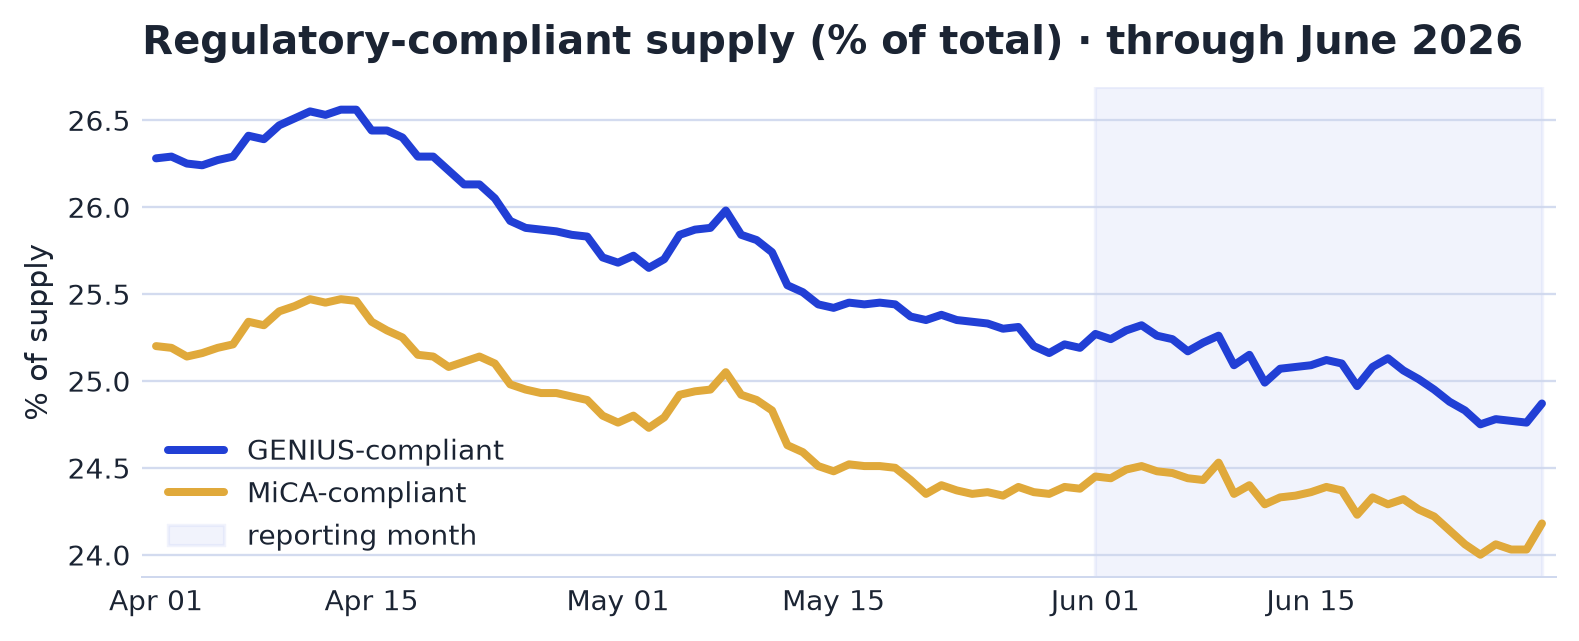
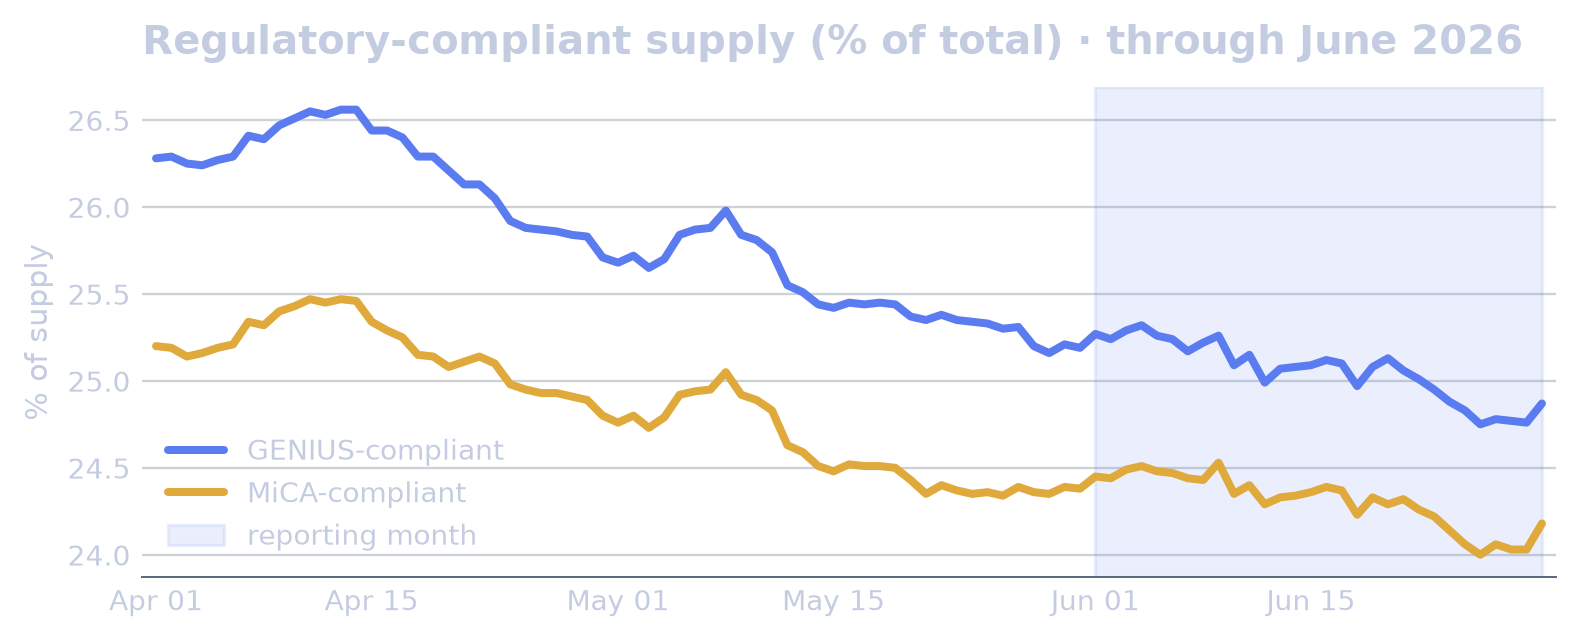
At end-June, GENIUS Act-compliant stablecoin supply stood at $76.41B, equal to 25% of total supply, while MiCA-compliant supply stood at $74.28B, or 24% of the market. Each regime covered only about a quarter of outstanding stablecoins.
Overlap dominated the two compliant categories. The GENIUS- and MiCA-compliant totals were overwhelmingly the same asset, USDC, so the two figures described largely the same supply base. USDT, the largest stablecoin, sat outside both frameworks, leaving most of the market outside both. In the accompanying compliant-coin tables, the main standouts were compositional: USDC anchored both regimes, while USDT remained absent from both.
Peg Currency & Dollarisation
| Segment | End of month | % of total | Avg (month) | vs prev month |
|---|---|---|---|---|
| USD | $300.84B | 97.9% | $304.04B | ▼ -2.1% |
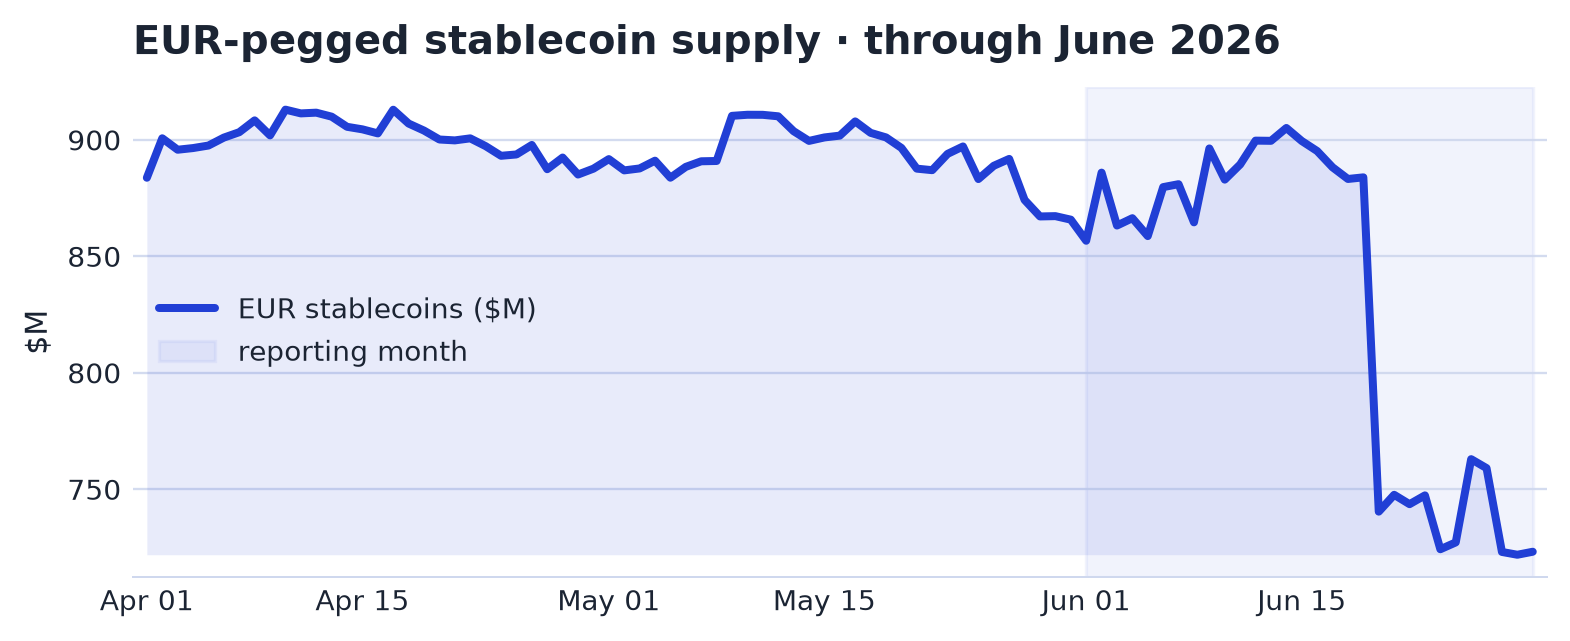
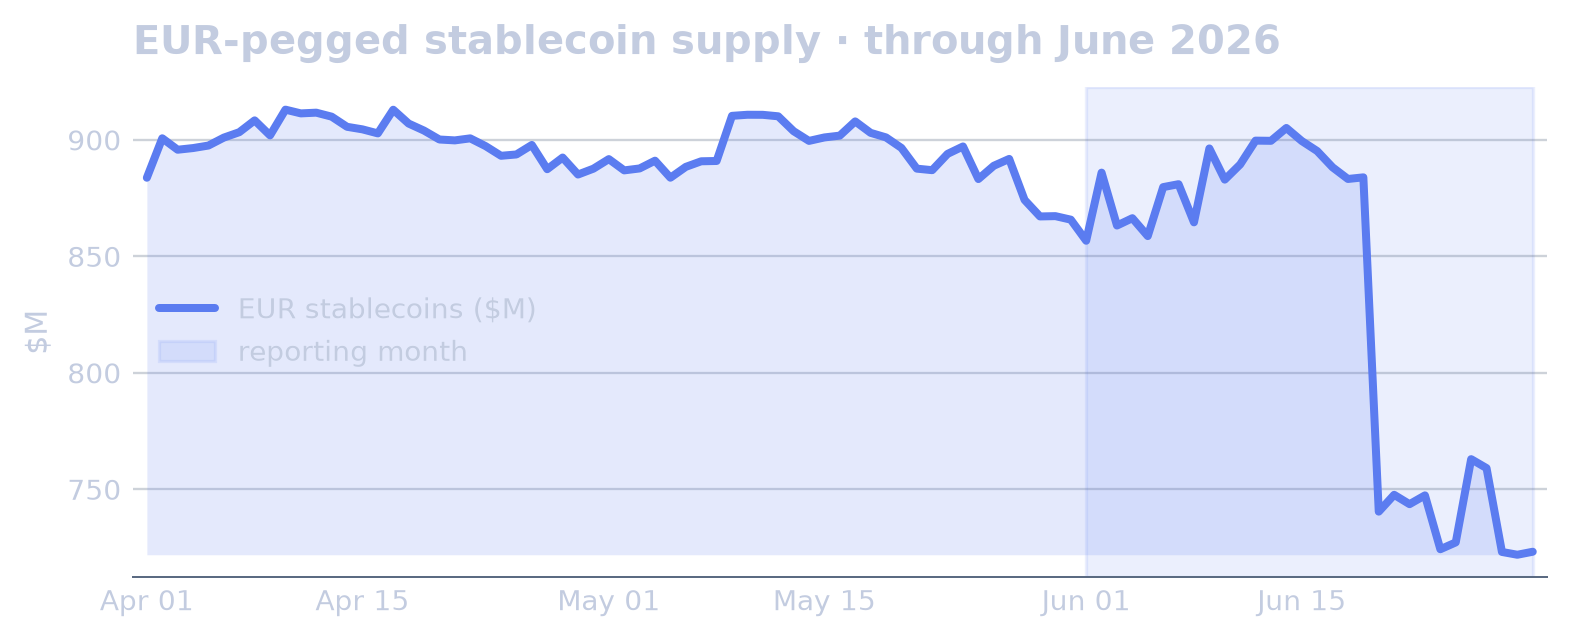
| EUR | $723M | 0.2% | $830M | ▼ -7.0% |
| GBP | $32M | 0.0% | $32M | new |
| CHF | $47M | 0.0% | $46M | ▲ +13.6% |
| JPY | $50M | 0.0% | $36M | ▲ +44521.2% |
| TRY | $12M | 0.0% | $12M | ▲ +121.3% |
| SGD | $12M | 0.0% | $13M | new |
At end-June 2026, stablecoin supply remained overwhelmingly dollar-denominated. USD-pegged tokens accounted for 97.9% of all supply, leaving the non-USD segment as a narrow long tail.
The euro remained the largest non-USD peg, with EUR-pegged supply at $723M. MiCA-compliant euro coins drove its lead. Other currency pegs, including GBP, CHF and JPY, remained nascent, while non-USD series stayed thin and partly forward-only.
Backing & Collateral Types
| Segment | End of month | % of total | Avg (month) | vs prev month |
|---|---|---|---|---|
| Fiat-backed | $289.94B | 94.4% | $293.76B | ▼ -2.0% |
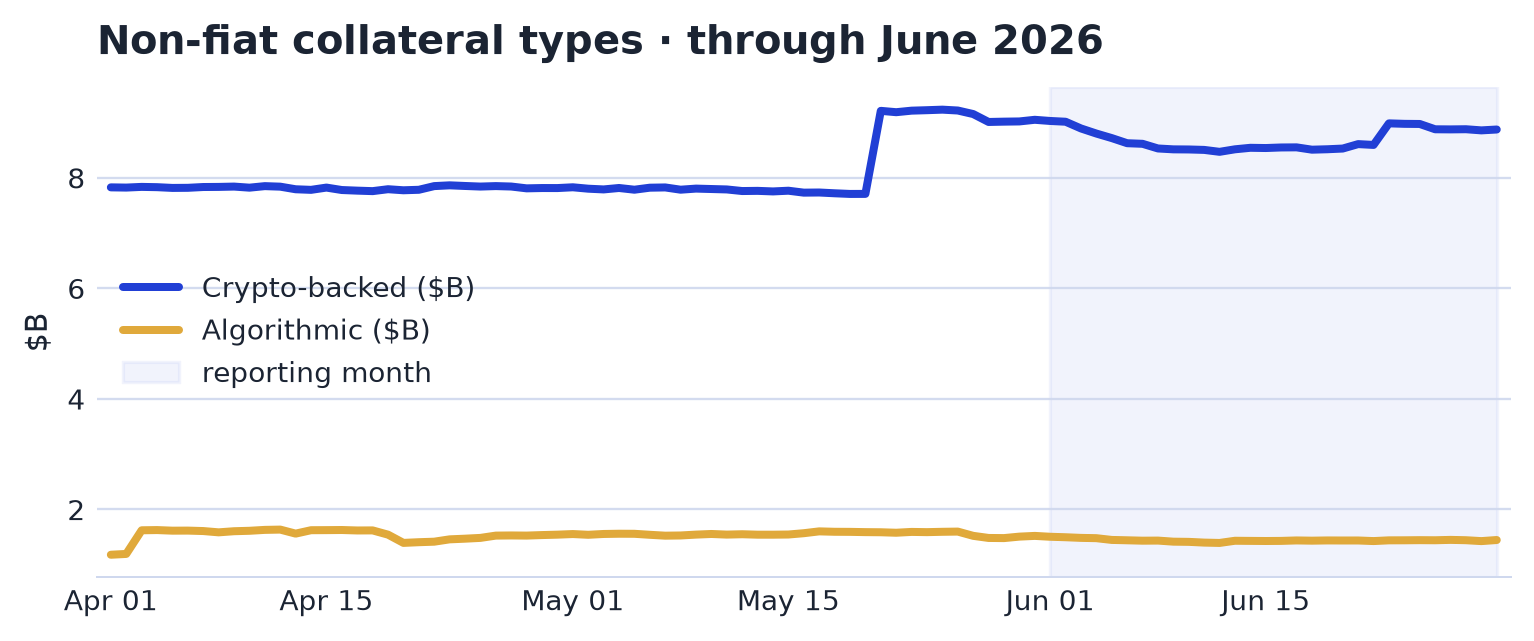
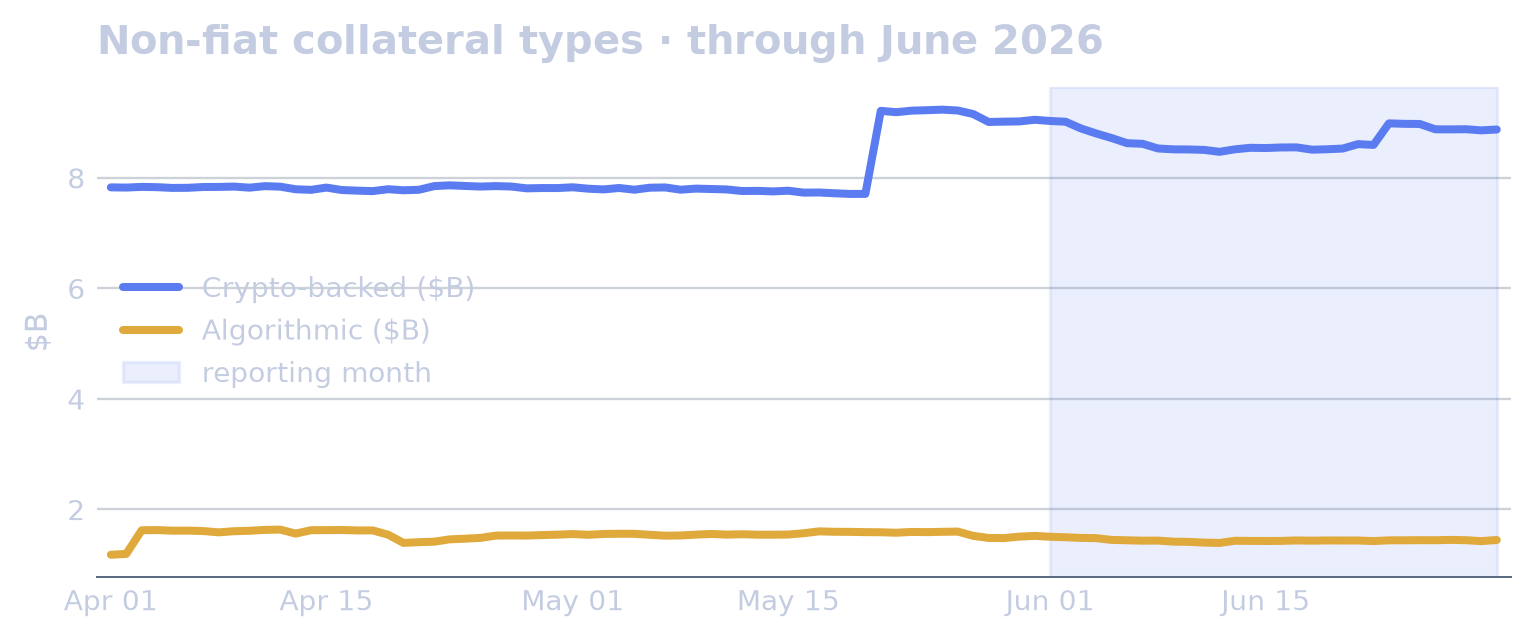
| Crypto-backed | $8.87B | 2.9% | $8.70B | ▲ +5.3% |
| Algorithmic | $1.44B | 0.5% | $1.44B | ▼ -7.3% |
| US Treasury-backed | $2.19B | 0.7% | $2.19B | ▲ +18.5% |
At the end of June 2026, fiat-backed stablecoins dominated the reserve-model mix at $289.94B, or 94.4% of supply. Crypto-backed stablecoins stood at $8.87B, equal to 2.9%, while algorithmic designs accounted for $1.44B, or 0.5%. US Treasury-backed stablecoins were $2.19B, representing 0.7% of supply.
The distribution remained heavily concentrated in fiat-backed instruments, at roughly 95% of supply. The smaller crypto-backed and algorithmic tail was limited in aggregate size, at $8.87B and $1.44B, respectively. These categories described backing models, while reserve quality varied by issuer.
Stability & Activity
Peg Stability & Risk
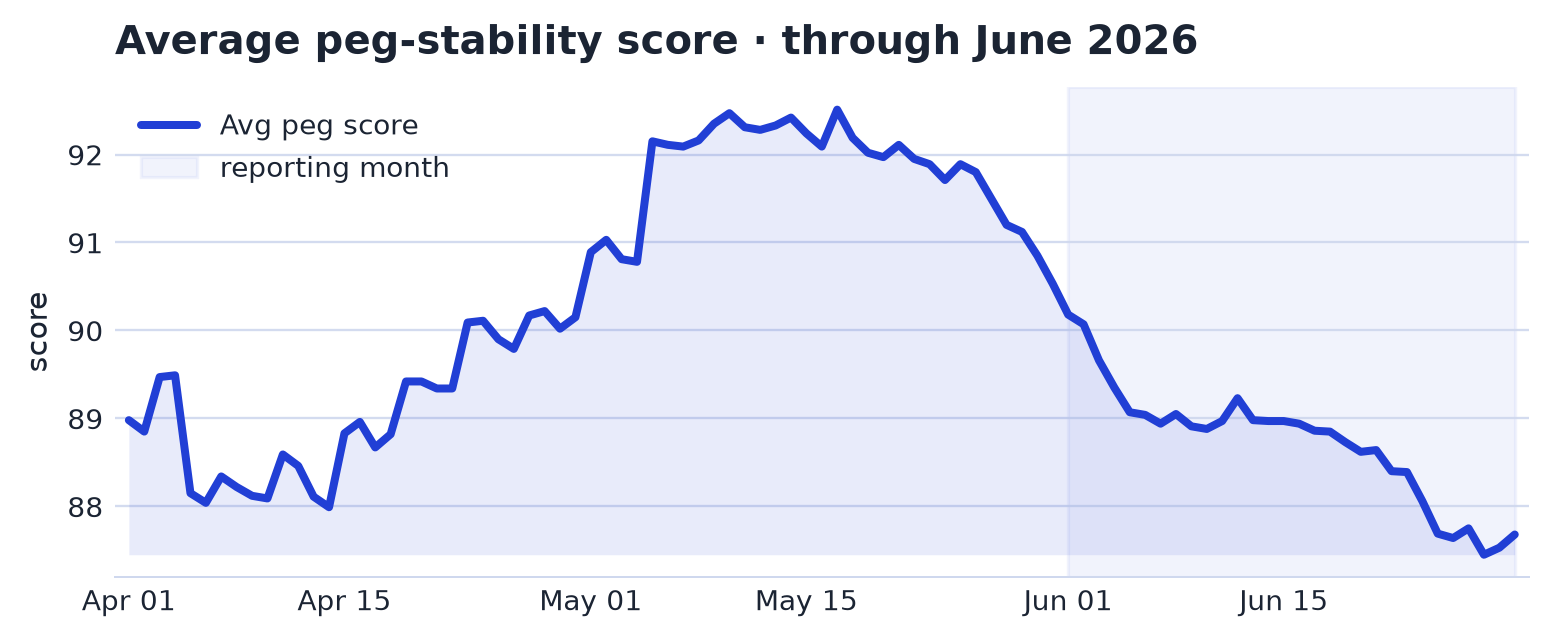
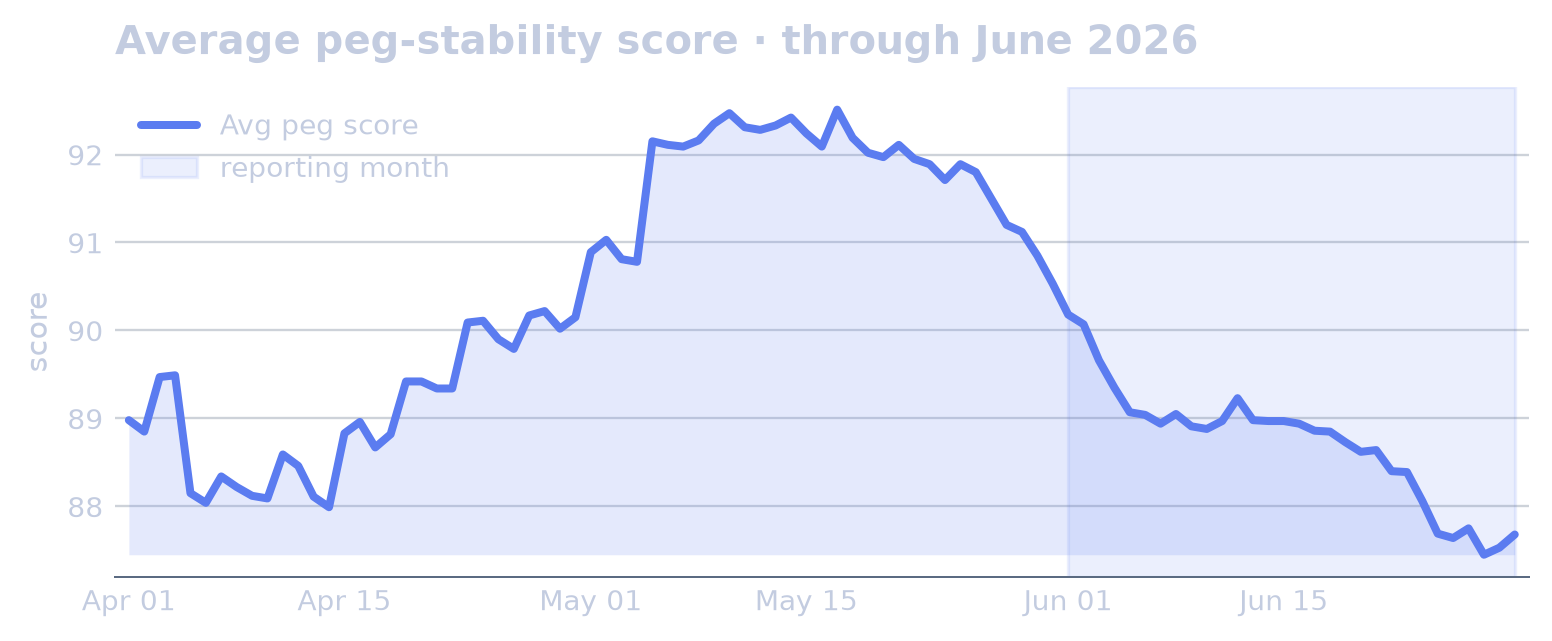
The average peg score, a 0–100 stability score in which 100 meant holding $1.00 all month and lower readings captured drift and off-peg days, fell from 90.2 to 87.7, a decline of 2.77% and a second consecutive monthly fall. The measure covered only dollar-pegged coins; euro- and other-currency stablecoins sat outside it because they required an FX reference. The number of coins off peg declined from 3 to 2, reversing the rise recorded in May 2026, while the worst deviation narrowed from 1.80% to 1.20%, down 33.40% and also reversing May 2026’s rise. Event frequency moved in the other direction: 30-day depeg events rose from 57 to 74, increasing for a second consecutive month.
Within the month, the breadth of off-peg stress first receded, with the count of coins off peg reaching its lowest observation in the data since 2025-04-09 on 2026-06-08. Price anomalies then appeared in individual names: USDD, the Tron-linked dollar, recorded its highest price in the data since 2025-04-09 on 2026-06-04, and USDG, the Global Dollar stablecoin, did the same on 2026-06-07.
Late in the month, event counts and tail deviations rose. Coins off peg peaked at 5 on 2026-06-25. On 2026-06-28, the maximum depeg deviation exceeded 0.50% and reached a peak of 2.70%, while total 30-day depeg events peaked at 76.
Trading Activity & Turnover
| Coin | Market cap | 24h volume | Turnover |
|---|---|---|---|
| USDT | $184.68B | $51.47B | 28% |
| USD1 | $4.65B | $1.10B | 24% |
| USDC | $73.62B | $14.17B | 19% |
| RLUSD | $1.41B | $151M | 11% |
| USDD | $1.37B | $101M | 7% |
| PYUSD | $2.69B | $191M | 7% |
| DAI | $4.62B | $231M | 5% |
| GHO | $598M | $15M | 2% |
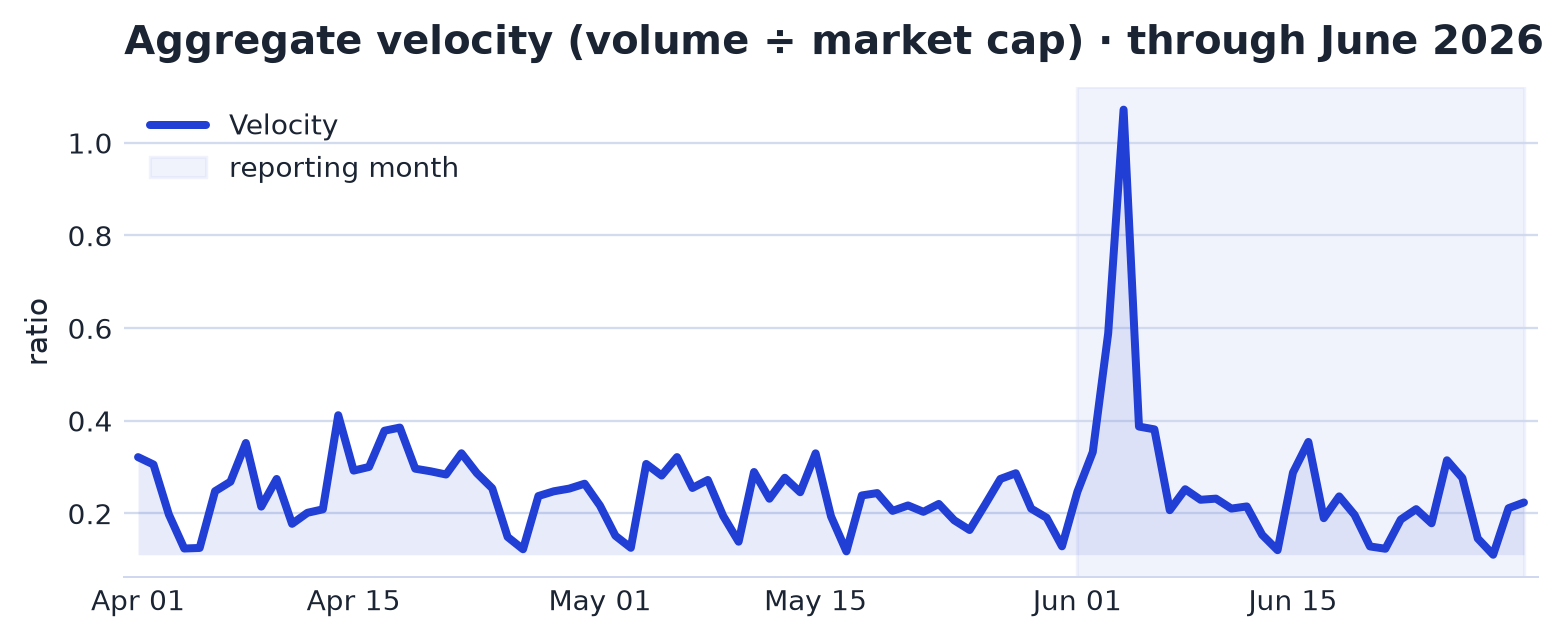
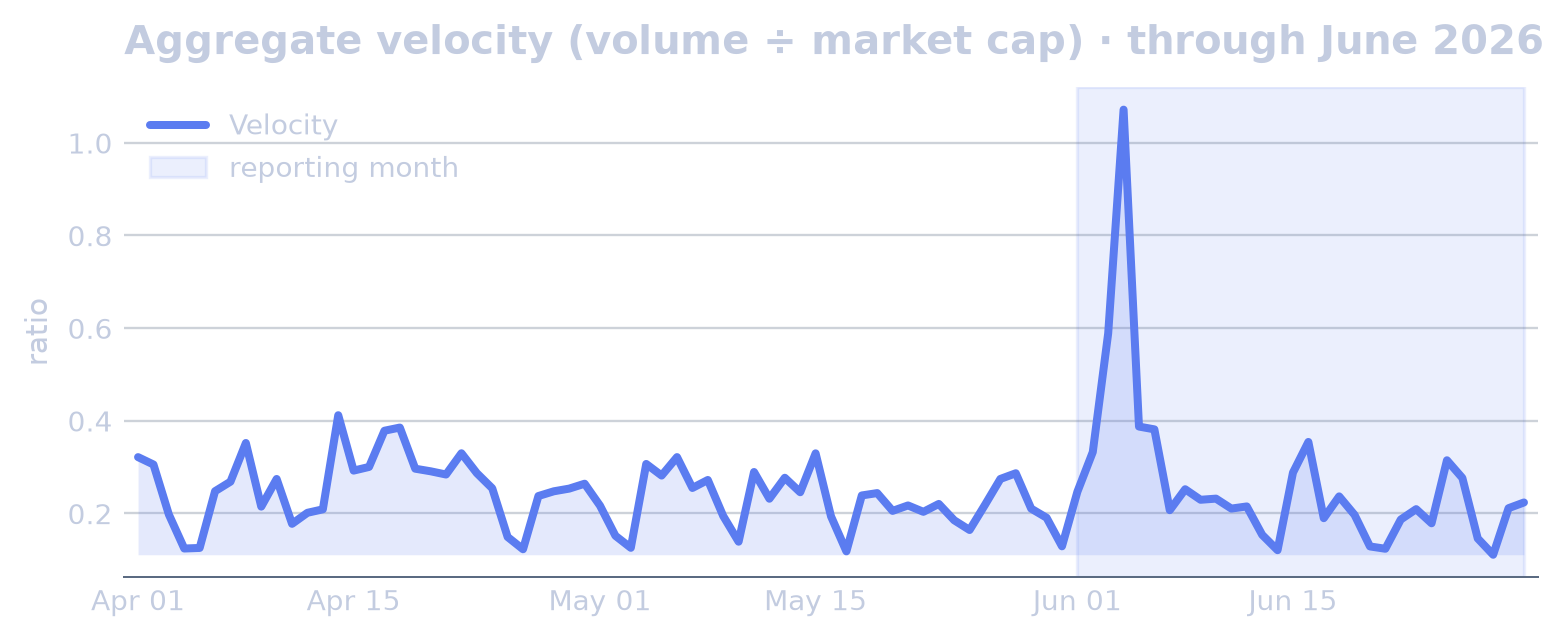
At end-June 2026, aggregate stablecoin velocity, measured as 24-hour trading volume divided by market capitalisation, stood at 0.2235. That was above the roughly 0.15 level associated with payment-like turnover, with trading activity elevated relative to the size of the stablecoin base.
Infrastructure
Network Distribution
| Network | End of month | Avg (month) | Range (min – max) | vs prev month |
|---|---|---|---|---|
| Ethereum | $154.09B | $156.66B | $154.09B – $160.40B | ▼ -4.0% |
| Tron | $89.13B | $89.33B | $88.80B – $90.00B | → -0.3% |
| Solana | $14.84B | $14.98B | $14.56B – $15.50B | ▲ +0.6% |
| BSC | $14.21B | $13.83B | $13.32B – $14.28B | → +0.3% |
| Hyperliquid L1 | $5.90B | $6.40B | $5.90B – $7.01B | ▲ +10.2% |
| Base | $4.81B | $4.74B | $4.57B – $4.83B | → +0.2% |
| Arbitrum | $3.88B | $3.86B | $3.72B – $4.05B | ▲ +2.3% |
| Polygon | $3.38B | $3.45B | $3.31B – $3.74B | ▼ -0.8% |
| Aptos | $1.87B | $1.90B | $1.81B – $2.07B | ▲ +10.8% |
| X Layer | $1.84B | $1.66B | $1.48B – $1.84B | ▲ +12.3% |
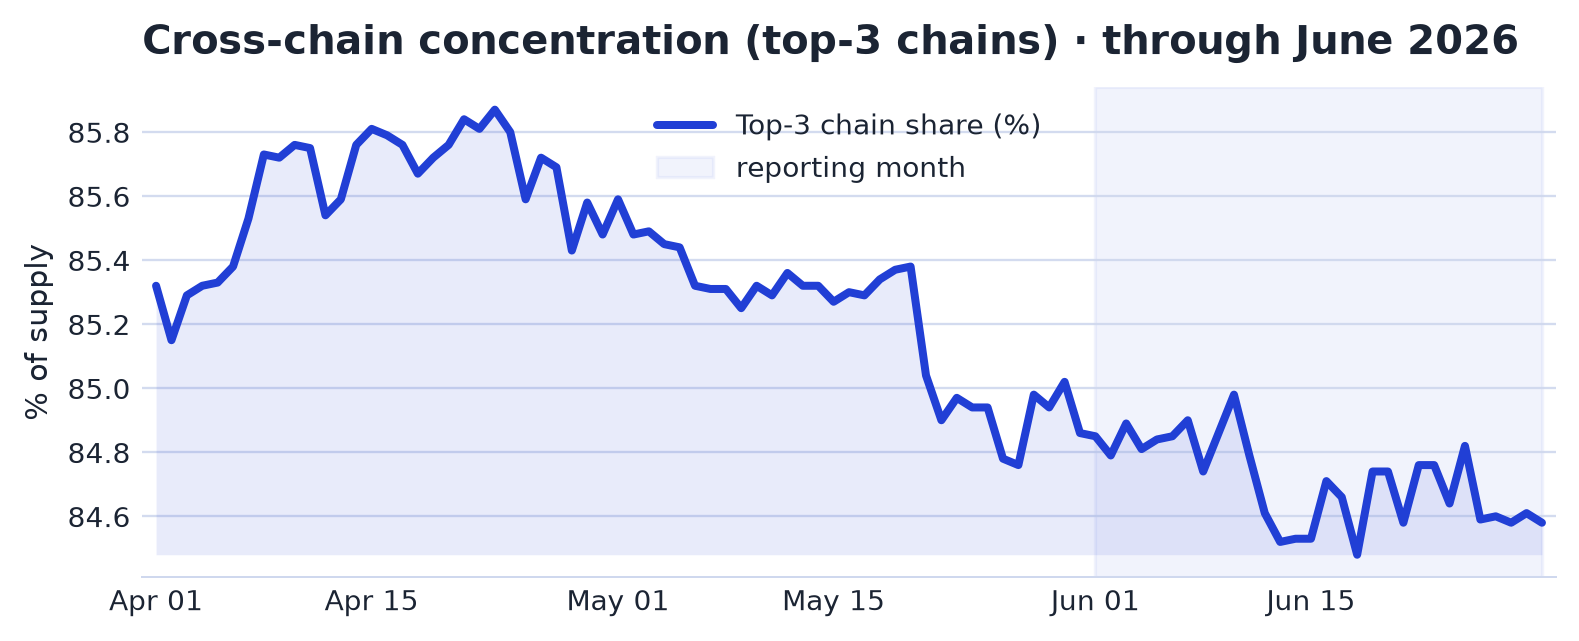
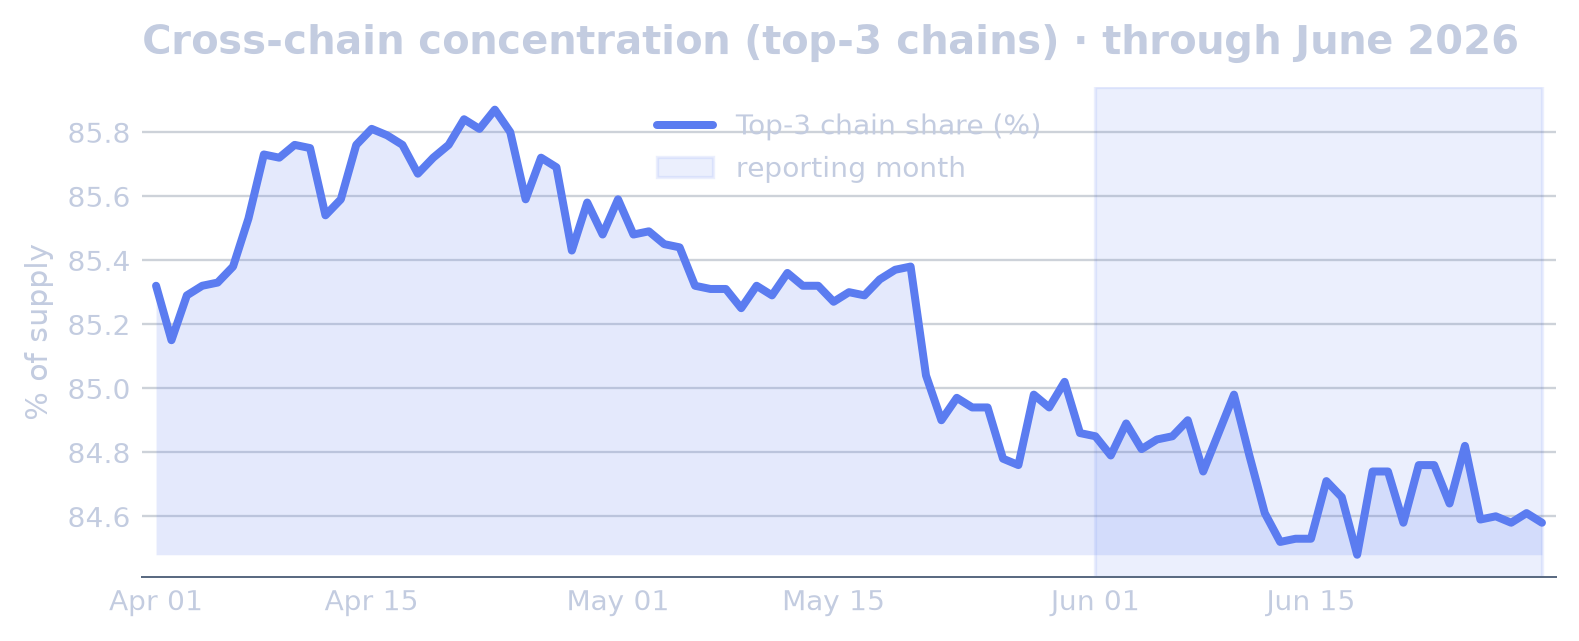
At end-June, stablecoin supply was concentrated across blockchains. The top three chains held 84.6% of supply, while the largest single chain accounted for 50.5%.
The distribution across chains had limited breadth, with cross-chain entropy at 2.23 bits. In supply terms, stablecoin balances were centred on a small set of networks, led by one chain with just over half of total supply.
Adjacent Segments
Yield-Bearing & Tokenized-Dollar Instruments
At end-June, the yield-bearing and tokenized-dollar segment stood at $14.61B, down $886M, or 5.7%, month on month across 80 tracked instruments. This segment sat adjacent to stablecoins and outside the headline stablecoin total. Yield-bearing wrappers such as sUSDe, a staked USDe wrapper, and sUSDS, a staked USDS wrapper, were staked forms of underlying stablecoins already counted in the headline total, so their value represented a subset of that supply and was excluded from aggregate stablecoin supply calculations. Standalone tokenized-treasury instruments such as USDY, Ondo US Dollar Yield, were money-market-like instruments outside the stablecoin universe; the figures described adjacent capital reaching for yield, with stablecoin growth measured separately. Tokenized commodities were unchanged in scale, ending the month at $50M, up $0M, or 0.3%, across 1 tracked instrument.
The contraction was concentrated in the largest yield-bearing wrappers. sUSDS ended at $5.53B after a $648M decline from the previous month-end, while sUSDe fell $114M to $1.67B. syrupUSDC, a yield-bearing USDC wrapper, declined $97M to $1.29B, and Savings USDD was little changed at $237M after a $2M decrease. BFUSD stood at $1.32B, with a $0M decline versus the previous month-end.
Several instruments expanded despite the segment-level decline. USDY increased $15M to $2.16B, syrupUSDT, a yield-bearing USDT wrapper, rose $74M to $492M, and ONYC, OnRe Tokenized Reinsurance, rose $15M to $206M. These gains left the upper tier led by sUSDS, followed by USDY, sUSDe, BFUSD and syrupUSDC at month-end.
Backdrop
Macro & Crypto Backdrop
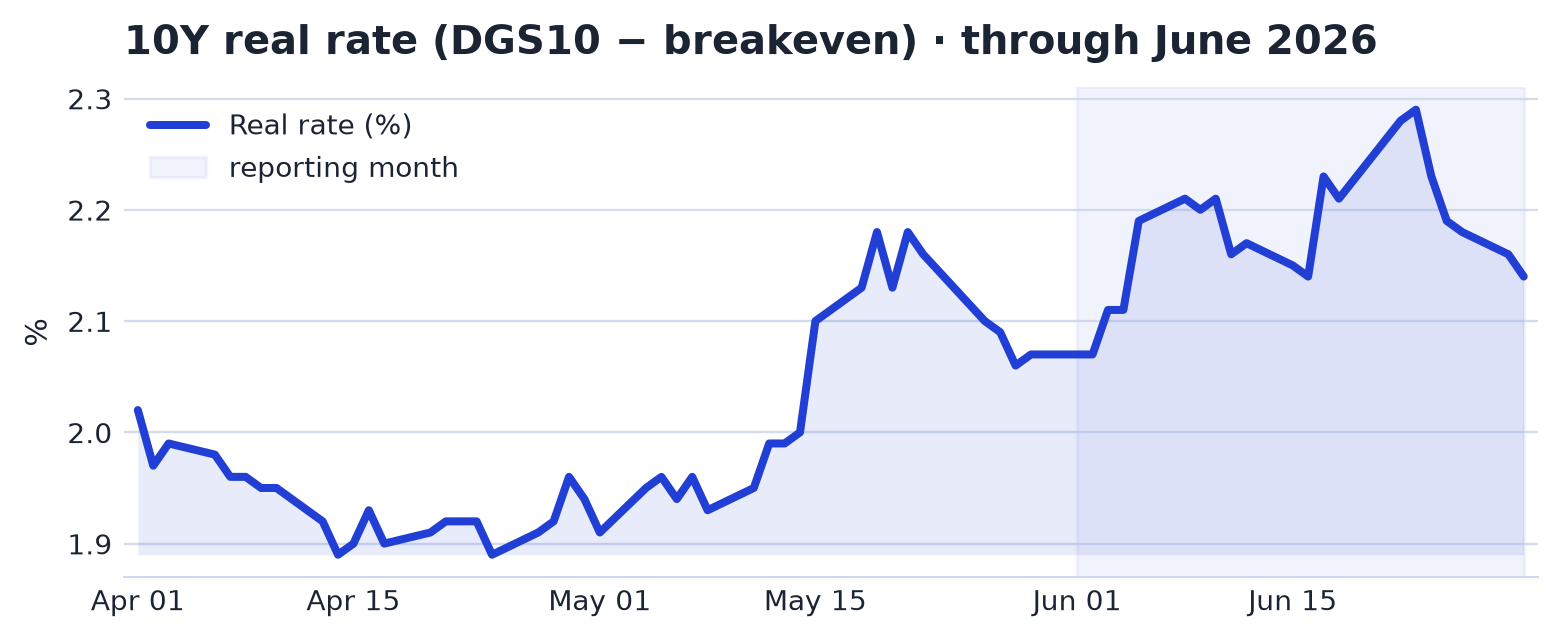
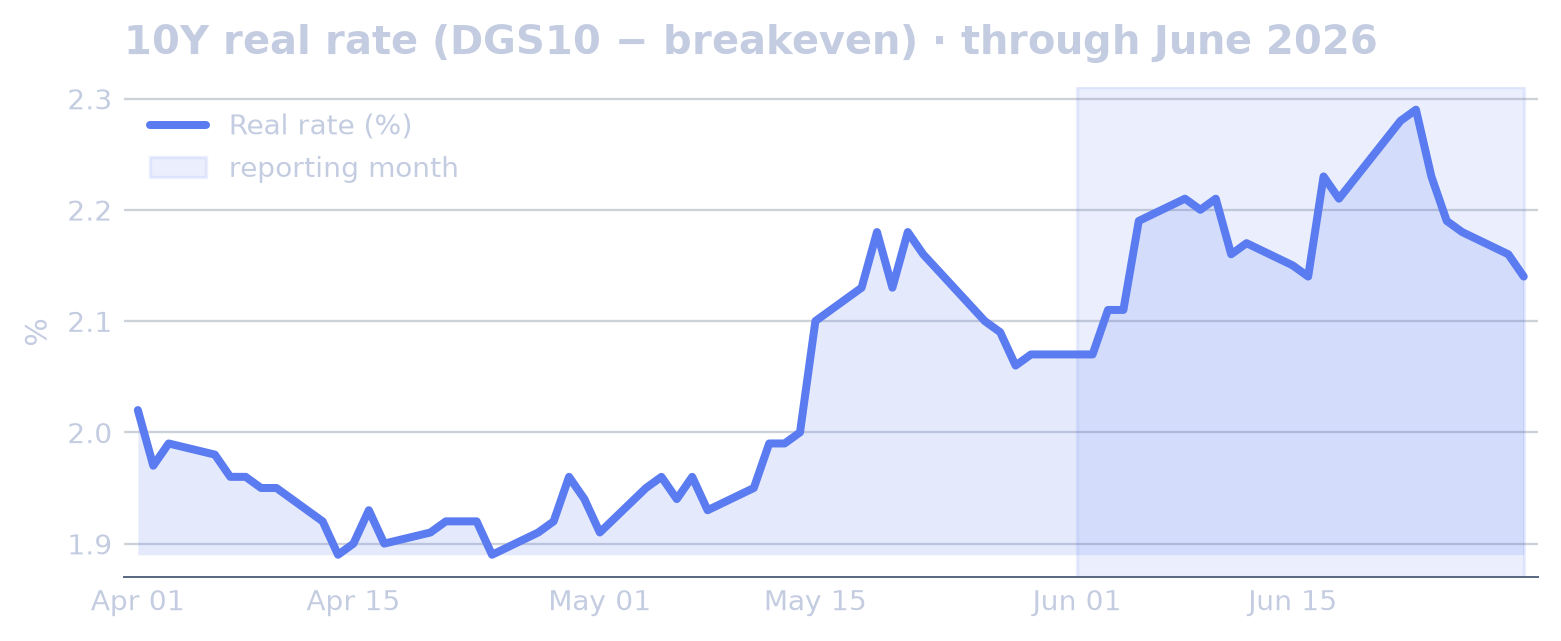
At end-June, the US 10-year yield stood at 4.38%, down from 4.47% at the start of the month, a 2.01% decline that reversed May’s rise. The 10-year real rate moved in the opposite direction, rising from 2.07% to 2.16%, a 4.35% increase and a second consecutive monthly gain. The broad dollar index rose for a second consecutive month, from 119 to 121, up 1.44%. Risk measures also weakened: the VIX rose from 16.05 to 17.65, up 9.97% and reversing May’s decline, while Bitcoin fell from $71,339 to $58,234, an 18.37% drop and a second consecutive monthly fall. BTC dominance declined from 56.90% to 55.34%, down 2.73% for a second consecutive month, and the Fear & Greed index fell from 29.00 to 15.00, down 48.28% and reversing May’s rise.
The macro context centred on the Iran conflict, repeated Strait of Hormuz headlines and energy-related geopolitical risk, alongside US inflation reported at 4.2% and global growth concerns. That combination coincided with a firmer dollar, higher real rates, lower Bitcoin and a lower Fear & Greed reading over the same period. Volatility rose early in the month, with the VIX increasing 39.68% day over day on 5 June, a 6.6σ move.
Rates events were concentrated around mid-month. On 16 June, the euro short-term rate recorded a level shift with a 7.1σ effect, while the ECB deposit facility rate recorded a level shift with a 7.2σ effect. The US 2s10s yield curve then fell 23.68% day over day on 17 June, a 5.7σ move, with the US 2-year Treasury yield accounting for 167% of the move and the US 10-year Treasury yield for 67%. On 23 June, the curve rose 25.93% day over day, a 6.2σ move, driven by the US 2-year Treasury yield, which accounted for 114% of the move, and the US 10-year Treasury yield, which accounted for 14%. For the month as a whole, the 2s10s yield curve averaged 2.9σ below baseline, with the US 10-year Treasury yield accounting for 82% of that move and the US 2-year Treasury yield for 18%.
Published by Stablecoin Beat · free to read and cite under CC BY 4.0. · Download the PDF · All reports · Methodology