Stablecoin Market Report — May 2026
Stablecoin supply was little changed in May, slipping from $311.11B to $309.81B, a decline of 0.42%. The two largest coins lost share: USDT dominance fell from 58.3% to 57.8%, while USDC dominance declined from 23.7% to 23.3%. In the 7 May cluster, total market capitalisation rea
All levels as of 31 May 2026 · changes vs 30 Apr 2026
The Market
Market Structure & Supply
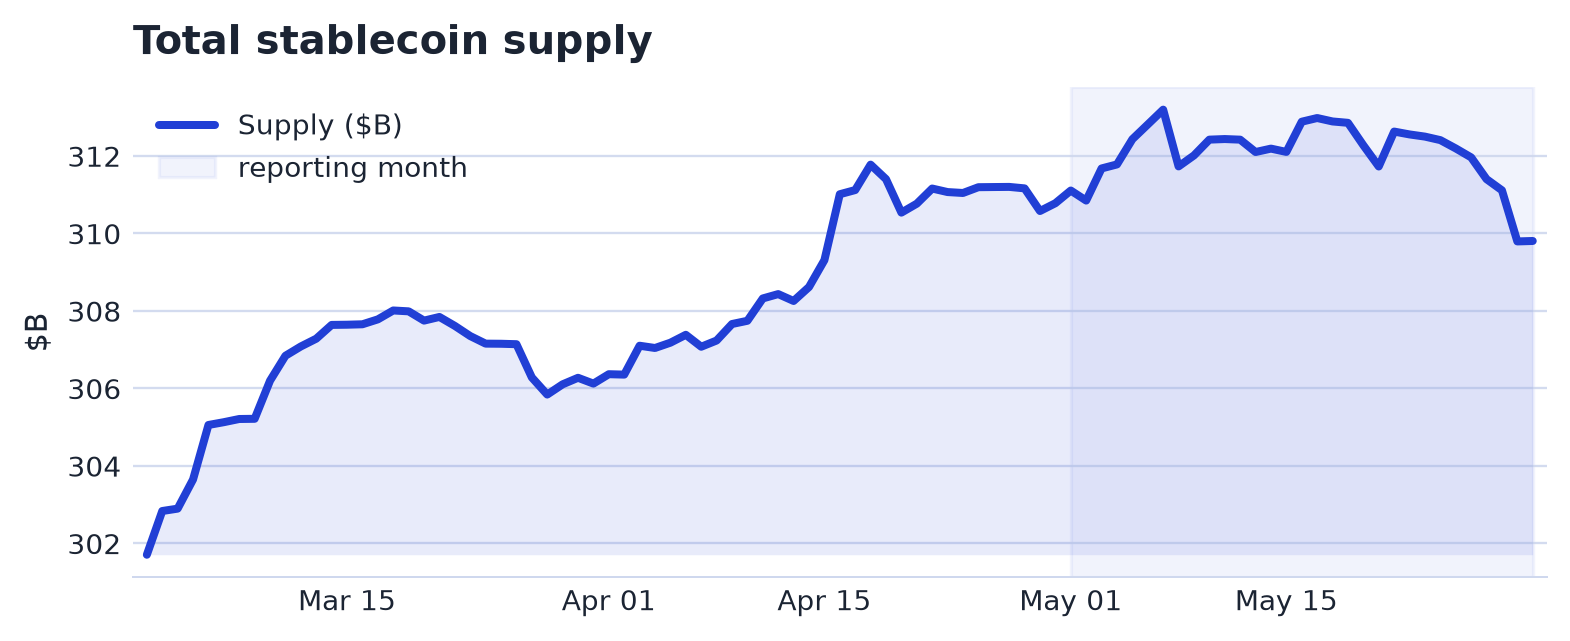

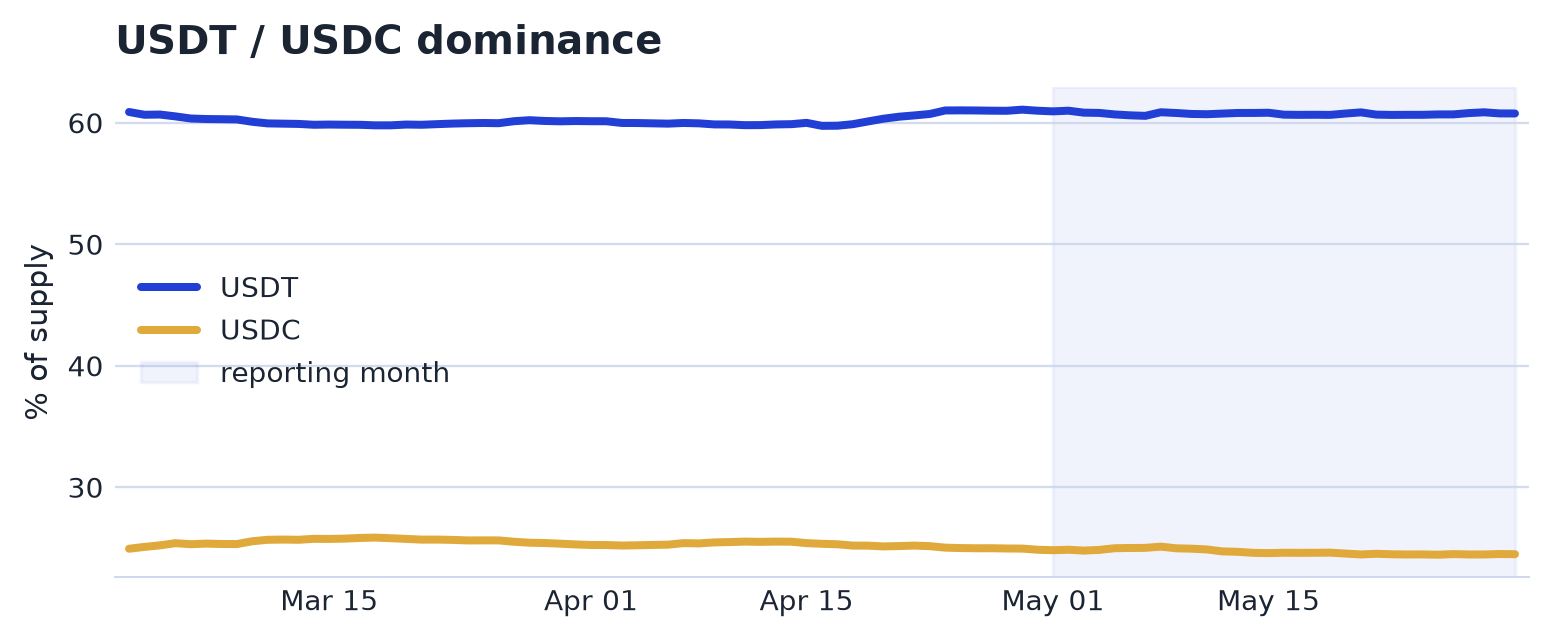
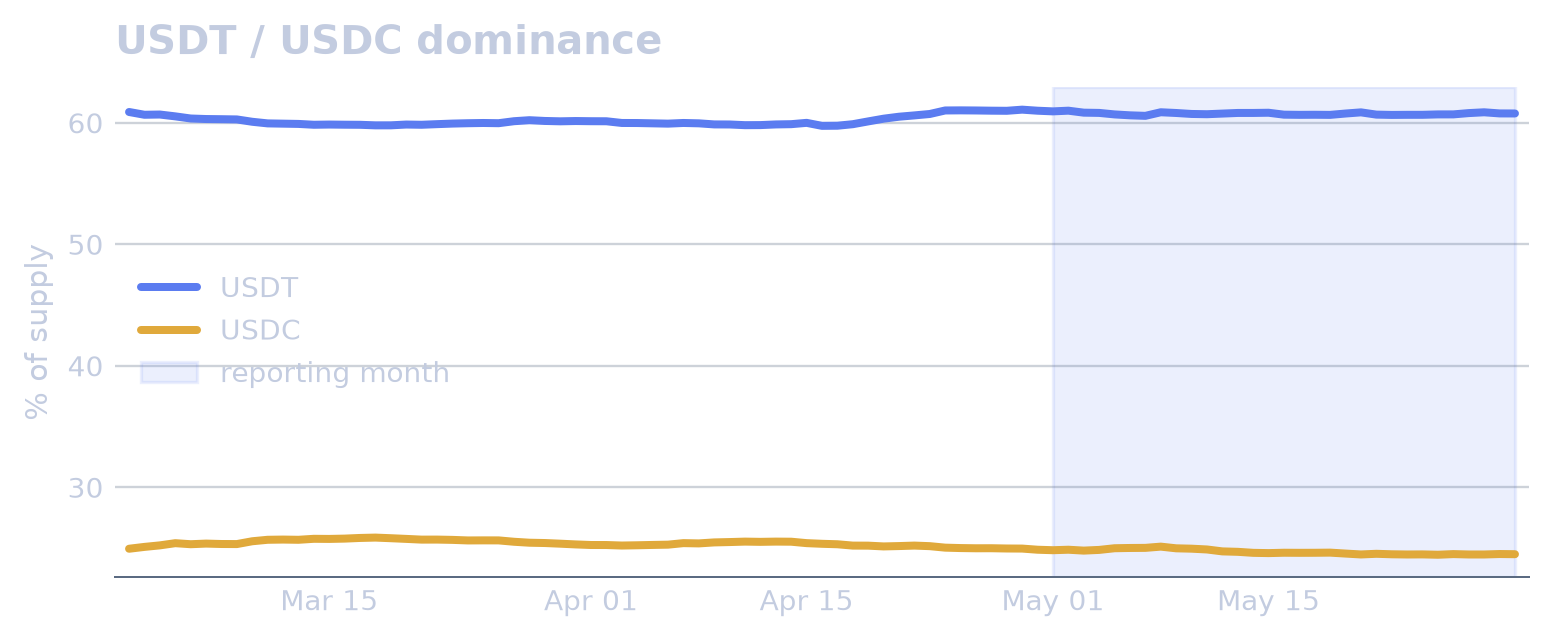
Stablecoin supply was little changed in May, slipping from $311.11B to $309.81B, a decline of 0.42%. The two largest coins lost share: USDT dominance fell from 58.3% to 57.8%, while USDC dominance declined from 23.7% to 23.3%. In the 7 May cluster, total market capitalisation reached its highest level in the data since 2025-04-09; USDS, the Sky Protocol dollar, accounted for 40% of the move, USDC for 33%, USDT for 26% and AUSD, the Agora dollar, for 22%.
In the same 7 May episode, token-level HHI rose 0.89% day over day, a 3.3σ move, driven chiefly by USDT at 92%, with USDC at 14%, USDS at 4% and SUSDS, staked Sky dollar, at 1%. Issuer HHI increased 0.86% day over day, also 3.3σ, with Tether accounting for 99% of the move, Circle for 15% and Sky/MakerDAO for 14%. Within that cluster, USDS market capitalisation fell 10.41% day over day, a 6.6σ decline.
Several tracked coins showed large moves. RLUSD, Ripple USD, reached its highest market capitalisation in the data since 2025-04-09 during the 20 May cluster, which included a 16.76% day-over-day increase, a 9.6σ move, and a 7.14% day-over-day decline, a 4.1σ move. USDG, the Global Dollar, also set its highest market capitalisation in the data since 2025-04-09 in the 12 May cluster, alongside a 16.17% day-over-day increase, or 4.6σ, and a 10.61% day-over-day decline, or 3.0σ. USDTB, Tether’s tokenized treasury product, had the most pronounced set of listed moves: the 14 May cluster included day-over-day changes of 29.86%, 32.75%, 18.00% and -15.25%, corresponding to 11.2σ, 12.3σ, 6.7σ and -5.7σ, and also marked its lowest reading in the data since 2025-04-09. Over the month, USDTB rose 81.6%, a 5.3σ move versus its typical 30-day move, while realised volatility ran at 3.4x its baseline.
Among tracked coins above $1B, USDTB led monthly growth, rising 81.6% to $1.06B. RLUSD increased 16.5% to $1.70B, USDE, Ethena’s synthetic dollar, rose 15.3% to $4.50B, and SUSDS gained 11.1% to $6.18B. The largest decline was PYUSD, PayPal USD, down 9.4% to $3.06B, followed by USDF, Falcon USD, down 6.6% to $1.66B; USDG rose 7.0% to $2.62B, and USD1, World Liberty’s dollar, increased 4.9% to $4.72B.
Concentration & Competition
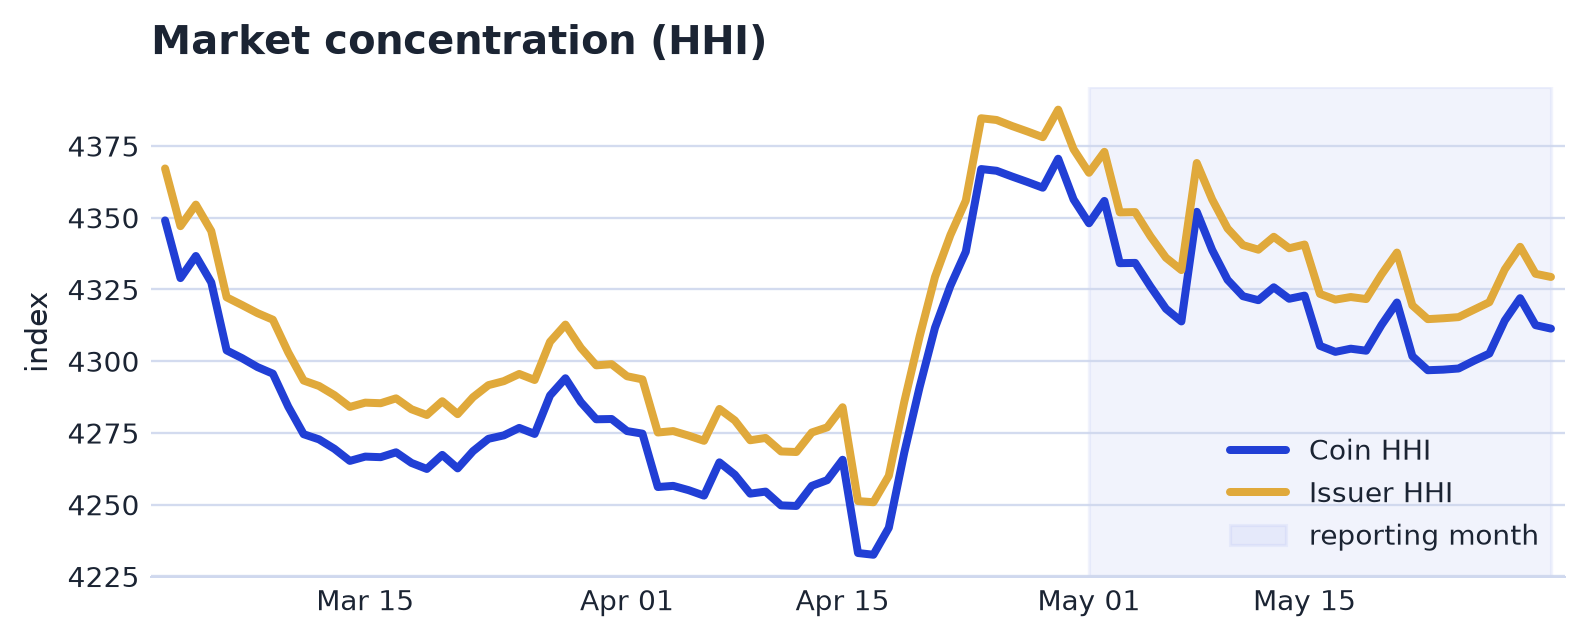
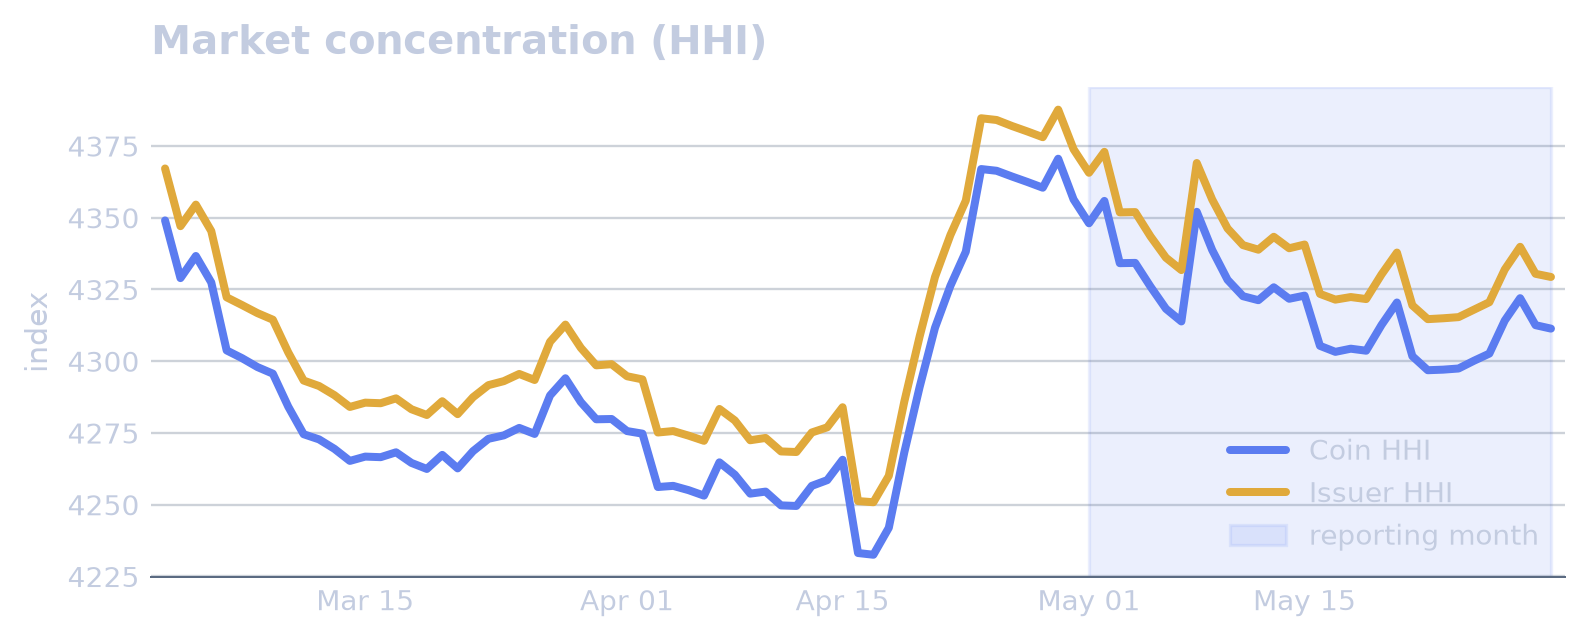
In May 2026, concentration measures edged down but remained high. Market HHI moved from 4,348 at the start to 4,311 at month-end, a decline of 0.84%. Issuer HHI followed the same pattern, falling from 4,366 to 4,329, or 0.83%, while the issuer Theil index slipped from 3.71 to 3.69, down 0.31%.
No concentration or competition events were recorded during the month.
Composition
Regulatory Compliance (GENIUS & MiCA)
| Coin | Start of month | End of month | Change |
|---|---|---|---|
| USDC | $77.16B | $75.82B | -1.7% |
| PYUSD | $3.38B | $3.06B | -9.4% |
| USAT | $145M | $157M | +8.7% |
| USDP | $41M | $32M | -21.3% |
| FUSD | $10M | $10M | +1.0% |
| Coin | Start of month | End of month | Change |
|---|---|---|---|
| USDC | $77.16B | $75.82B | -1.7% |
| EURC | $436M | $435M | -0.3% |
| EURCV | $125M | $124M | -0.8% |
| EURI | $60M | $58M | -3.6% |
| EURE | $29M | $29M | -2.1% |
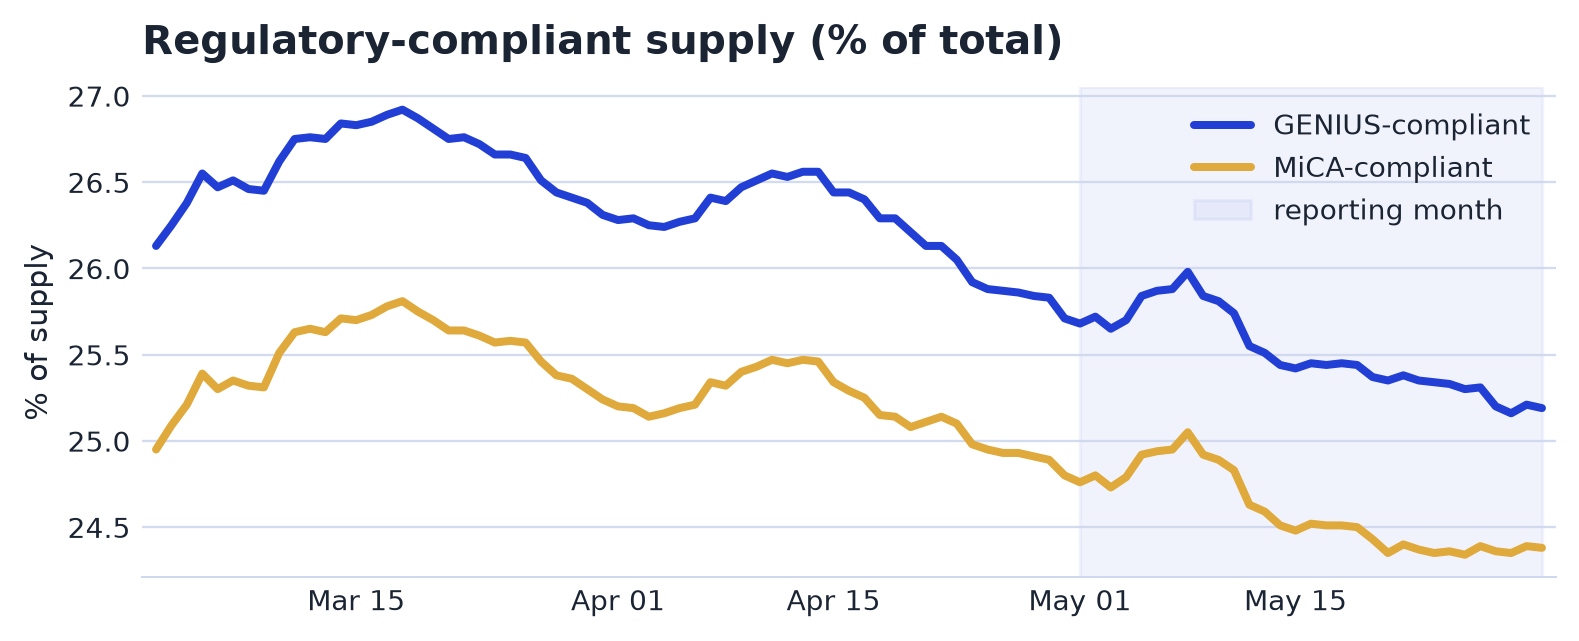
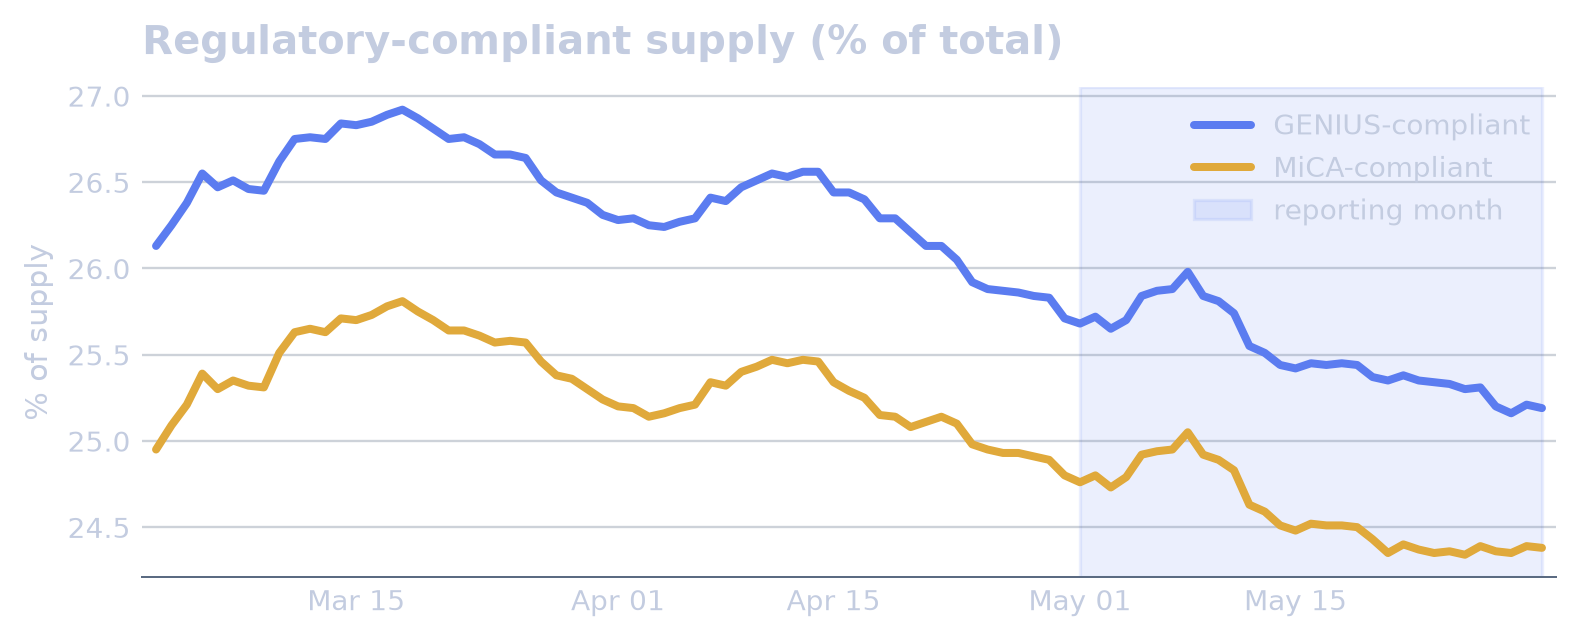
At end-May 2026, GENIUS Act-compliant stablecoin supply was $79.07B, equal to 25% of total supply. MiCA-compliant supply was $76.50B, or 24%. Each compliance measure covered only about a quarter of the market, and both were overwhelmingly the same coin, USDC; as a result, they are overlapping classifications rather than separate regulated pools and should not be added together.
USDT, the largest stablecoin, was compliant under neither framework. As a result, most stablecoin supply sat outside both GENIUS and MiCA at month-end, despite the similar headline shares for the two regimes. The accompanying tables of top compliant coins and monthly changes mainly identify the individual standouts within each framework; at the aggregate level, formal compliance coverage was concentrated in USDC and limited to roughly a quarter of supply under either regime.
Peg Currency & Dollarisation
| Segment | Market cap | % of total | 24h volume |
|---|---|---|---|
| USD | $308.29B | 98.2% | $40.15B |
| EUR | $866M | 0.3% | $86M |
| CHF | $41M | 0.0% | $1M |
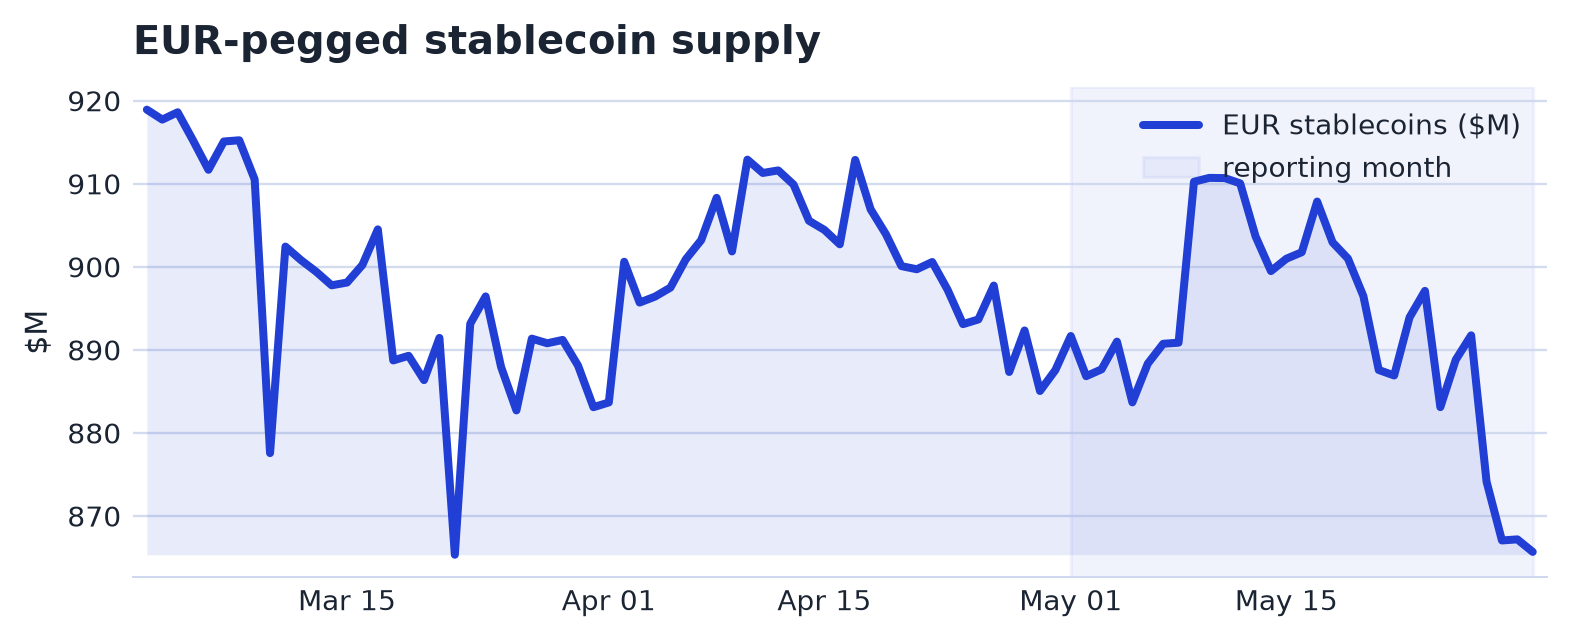
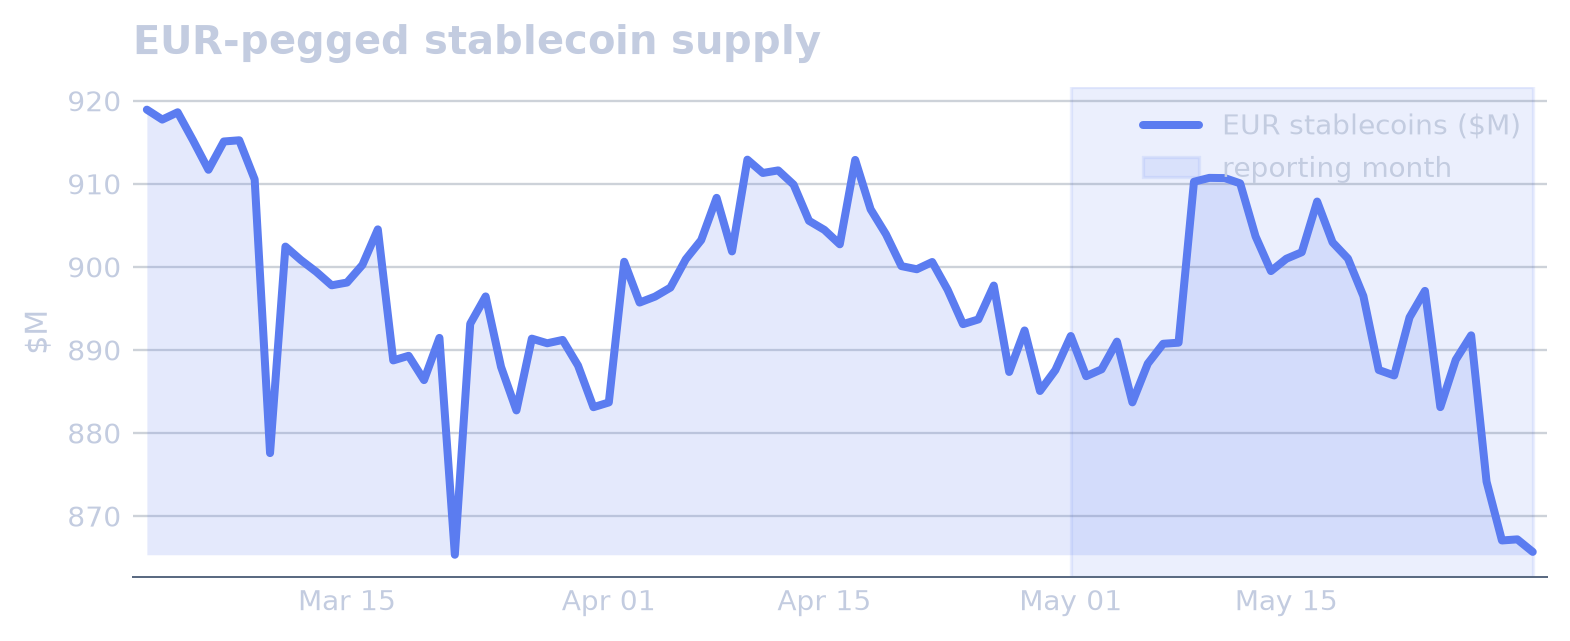
Stablecoin supply remained overwhelmingly dollar-denominated in May. USD-pegged instruments accounted for 98.2% of all supply at month-end, leaving non-USD pegs as a long tail rather than a parallel market. Within that tail, EUR-pegged supply stood at $866M, the largest non-USD peg.
The euro segment led the non-dollar market, driven by MiCA-compliant euro coins, while other currency pegs, including GBP, CHF and JPY, remained nascent. The accompanying table listed each currency’s size and share, while the EUR supply chart tracked euro supply; the thinner non-USD histories were partly forward-only, so month-end composition gave the cleaner read on dollarisation than short-run changes.
Backing & Collateral Types
| Segment | Market cap | % of total | 24h volume |
|---|---|---|---|
| Fiat-backed | $297.12B | 94.7% | $39.43B |
| Crypto-backed | $9.05B | 2.9% | $80M |
| Algorithmic | $1.52B | 0.5% | $3M |
| US Treasury-backed | $2.19B | 0.7% | $1M |
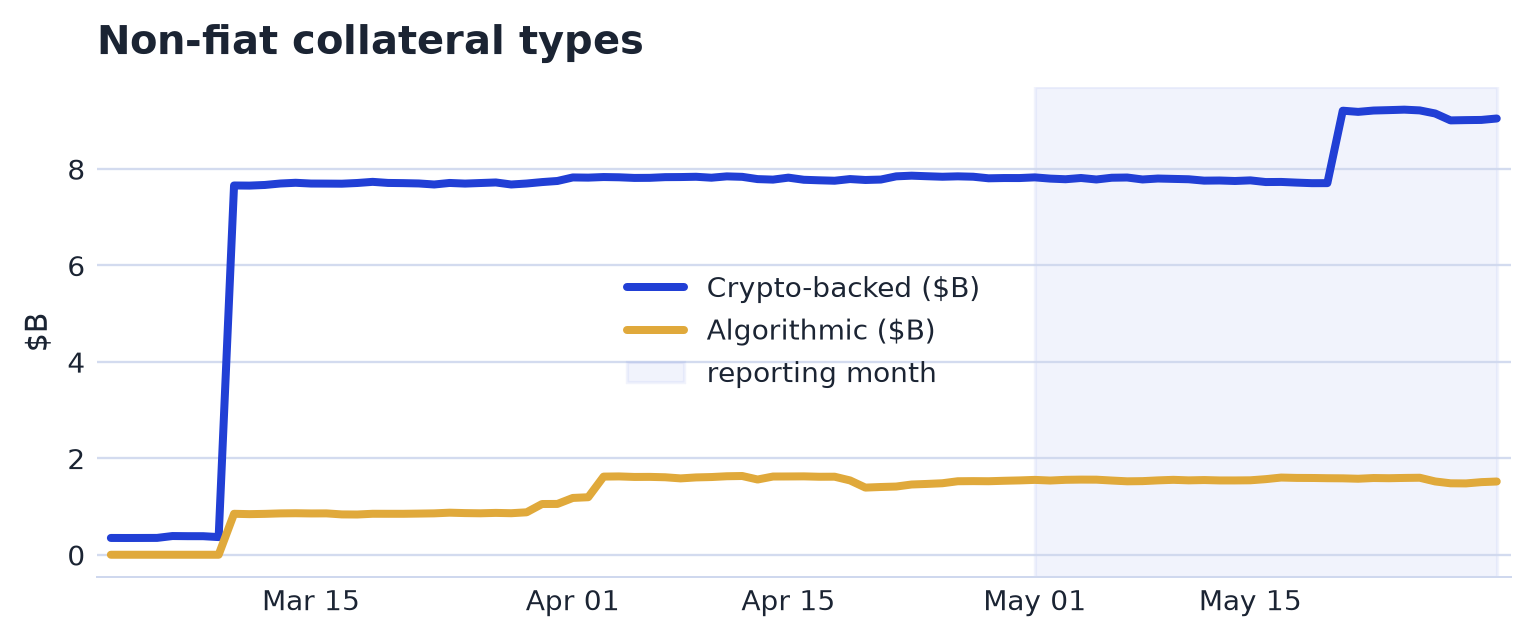
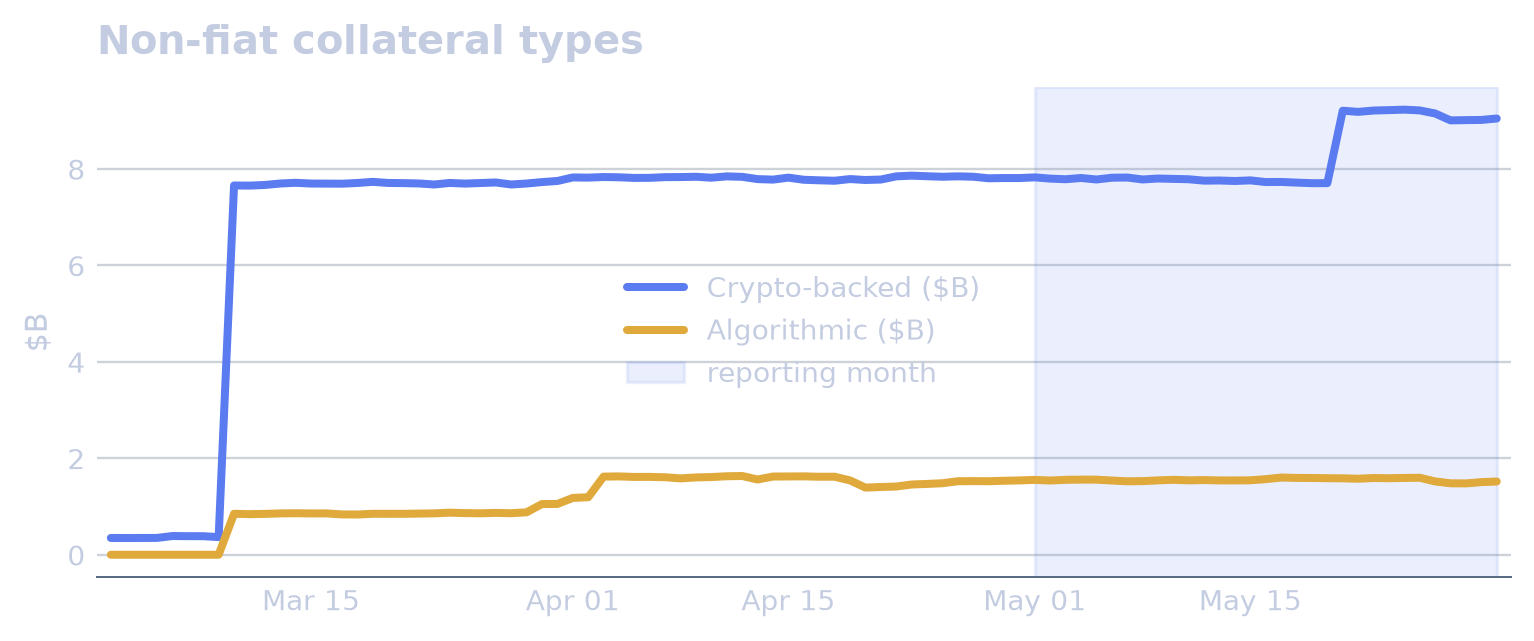
At end-May, fiat-backed stablecoins stood at $297.12B, or 94.7% of supply. Crypto-backed stablecoins accounted for $9.05B, or 2.9%, while algorithmic stablecoins were $1.52B, or 0.5%. US Treasury-backed stablecoins were smaller still at $2.19B, equal to 0.7% of supply.
The market remained overwhelmingly fiat-backed, at about 95% of supply, while the more telling movement sat in the small crypto-backed and algorithmic tail tracked in the accompanying chart. The table broke out each backing type’s size, share and 24h volume. “Fiat-backed” was CoinGecko’s classification; reserve quality varied by issuer and was not assessed here.
Stability & Activity
Peg Stability & Risk
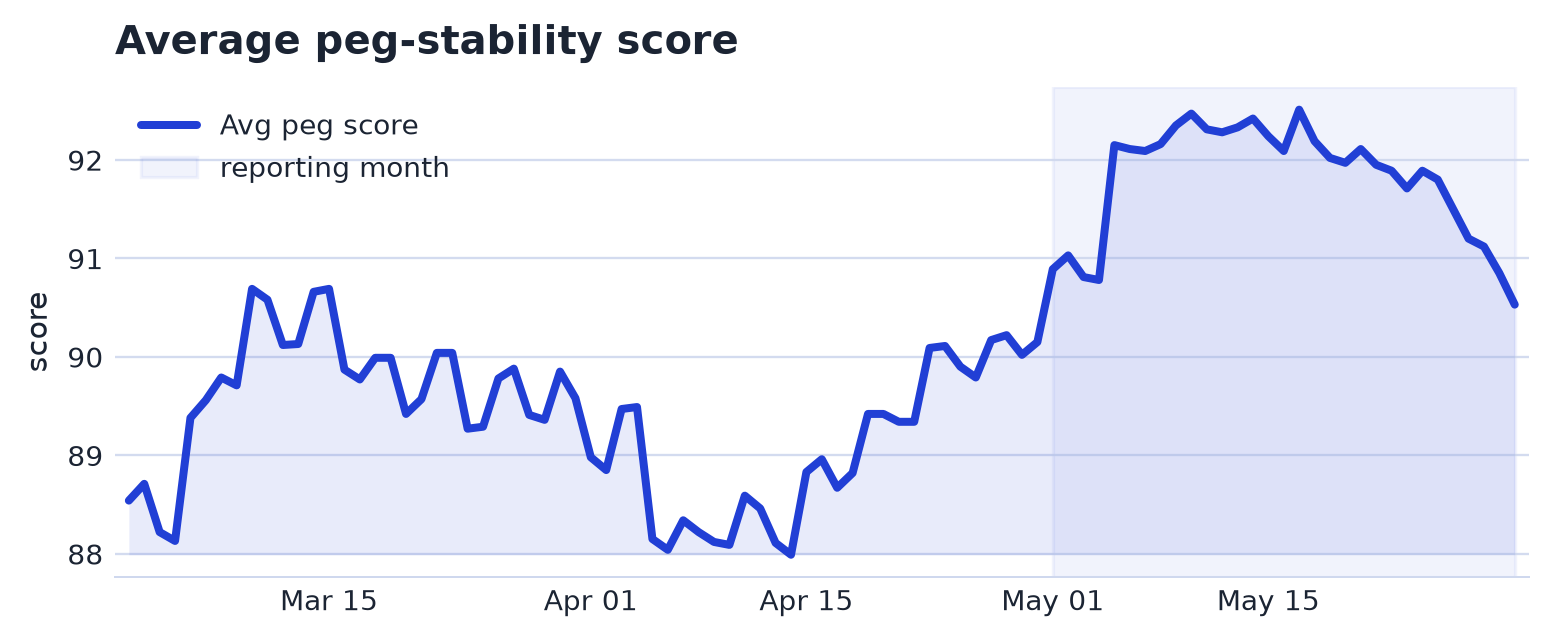
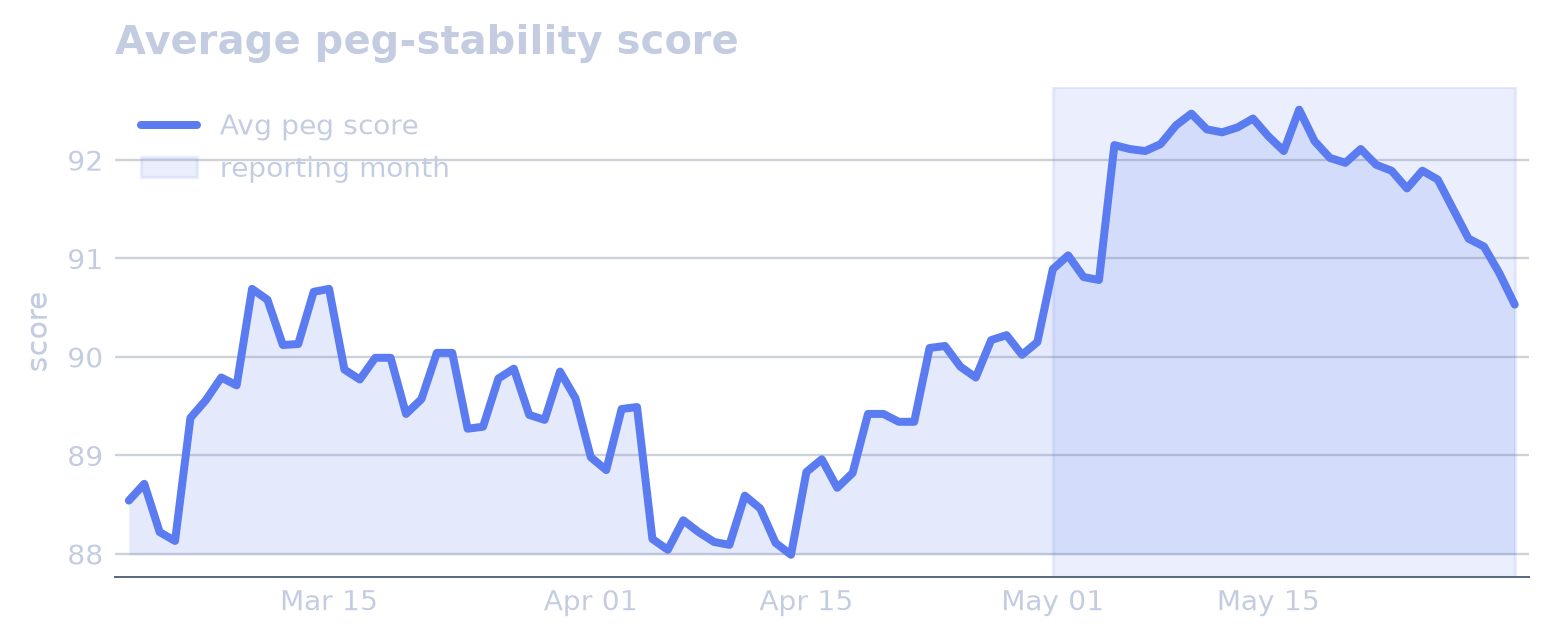
May closed with slightly weaker peg conditions. The average peg score declined from 90.9 at the start of the month to 90.5 at month-end, a -0.40% move. Coins off-peg rose from 1 to 3, while the worst deviation widened from 0.67% to 2.03%. Thirty-day depeg events also increased, from 51 to 55.
The key readings occurred in mid-to-late May. Coins off-peg peaked at 3 on 13 May, and USDF, a dollar stablecoin, traded at 0.9942 on 28 May, leaving it 0.58% off peg. By 31 May, the maximum depeg deviation had exceeded 0.50% and reached a peak of 2.03%, while total 30-day depeg events peaked at 55.
Trading Activity & Turnover
| Coin | Market cap | 24h volume | Turnover |
|---|---|---|---|
| USDT | $188.20B | $32.79B | 17% |
| USD1 | $4.72B | $737M | 16% |
| USDC | $75.82B | $6.06B | 8% |
| RLUSD | $1.70B | $48M | 3% |
| APXUSD | $542M | $15M | 3% |
| USDG | $2.62B | $43M | 2% |
| DAI | $4.37B | $58M | 1% |
| PYUSD | $3.06B | $36M | 1% |
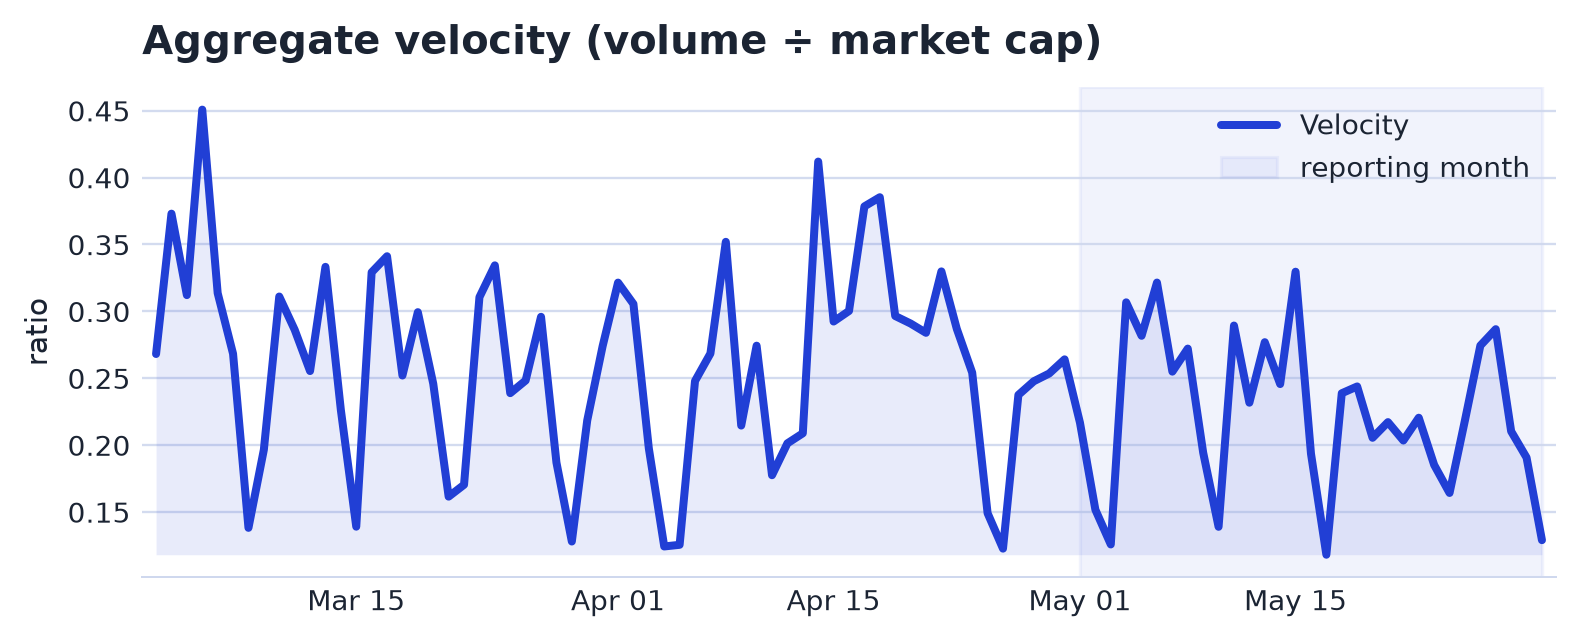
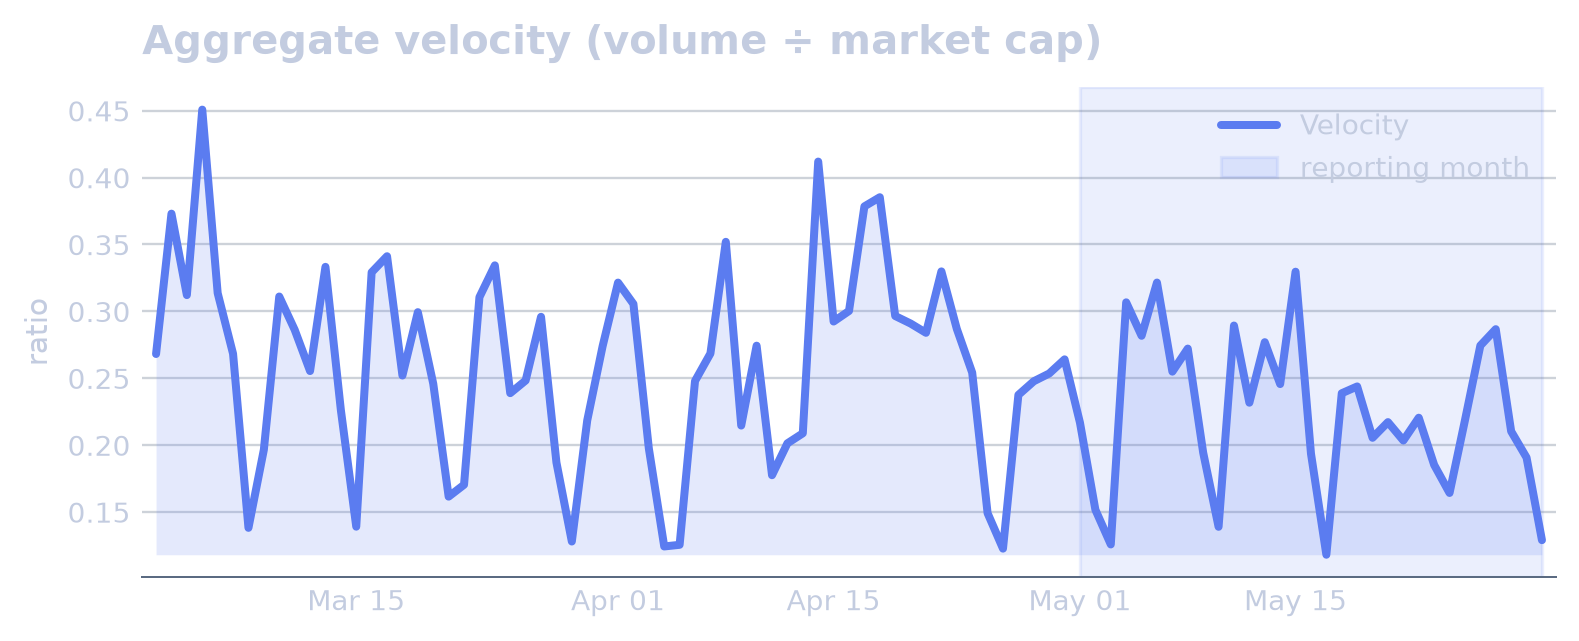
Aggregate velocity, measured as 24h exchange volume divided by market capitalisation, stood at 0.1289 at end-May. That put trading turnover below the ~0.15 reference level that suggests payment-like turnover rather than buy-and-hold activity when exceeded. The measure remained an exchange-trading metric from CoinGecko, not on-chain settlement volume.
The turnover ranking covered stablecoins with market capitalisation of at least $500M, while the aggregate chart tracked the same 24h-volume-to-market-cap velocity concept. The verified data listed no separate May events or driver decompositions for trading activity, leaving the month characterised by the end-period velocity reading alone.
Infrastructure
Network Distribution
| Network | Supply | % of supply |
|---|---|---|
| Ethereum | $160.40B | 51.3% |
| Tron | $90.11B | 28.8% |
| Solana | $14.66B | 4.7% |
| BSC | $13.91B | 4.5% |
| Hyperliquid L1 | $6.60B | 2.1% |
| Base | $4.60B | 1.5% |
| Arbitrum | $4.02B | 1.3% |
| Polygon | $3.69B | 1.2% |
| Aptos | $1.80B | 0.6% |
| X Layer | $1.46B | 0.5% |
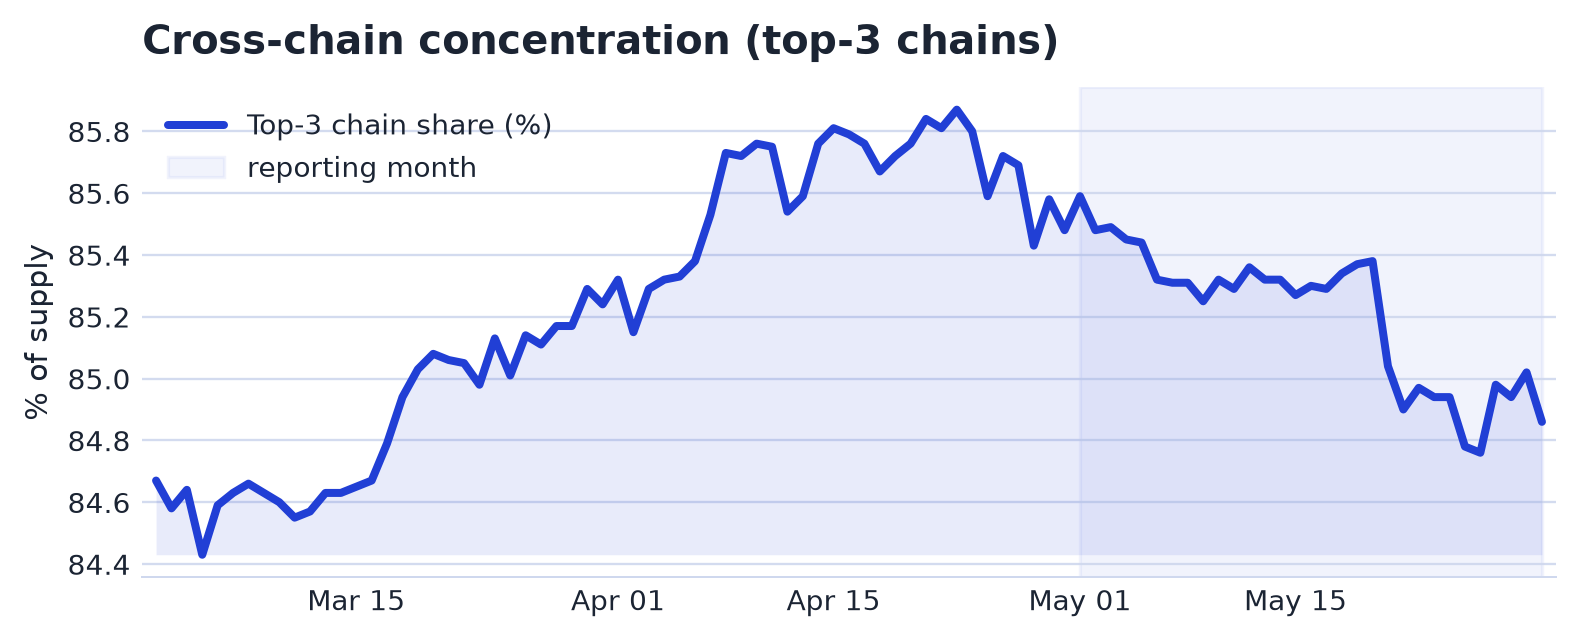
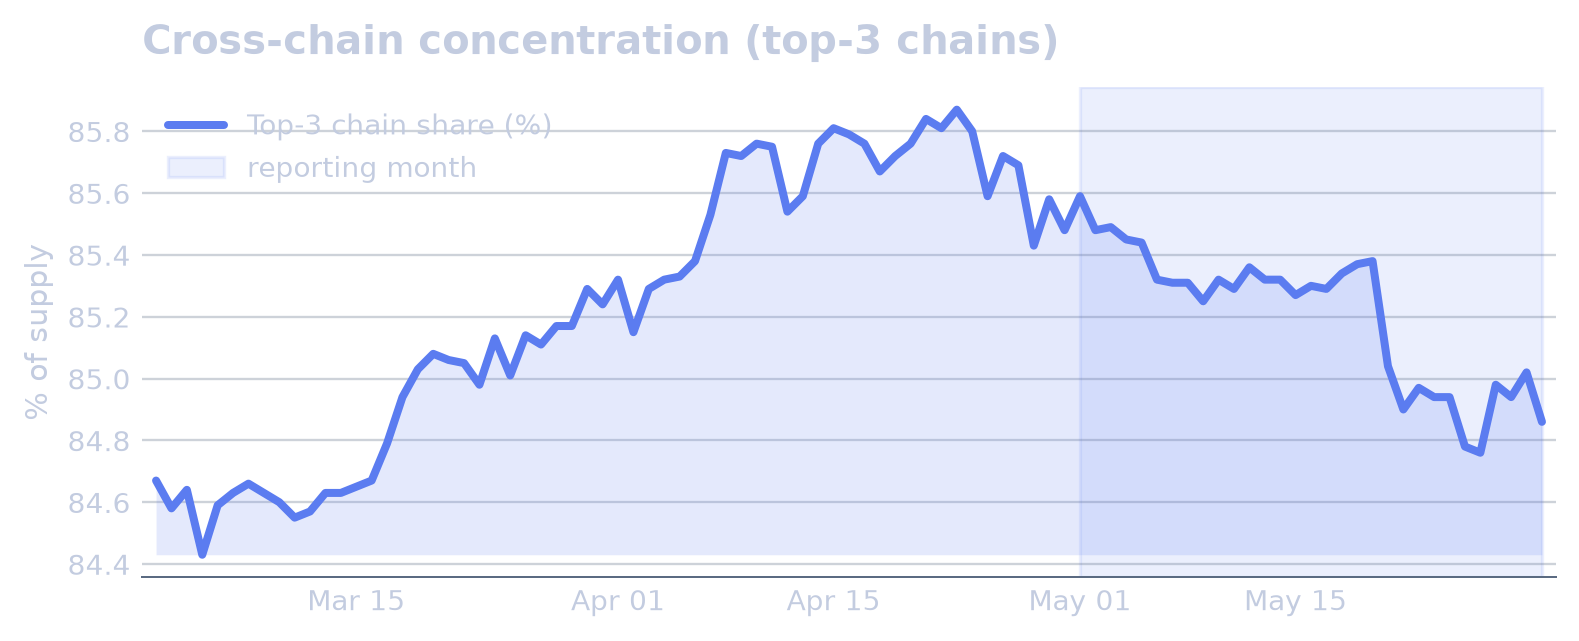
At end-May 2026, stablecoin circulating supply was concentrated across blockchains. The top three networks accounted for 84.9% of supply, while the largest single chain held 51.3%. Cross-chain entropy stood at 2.21 bits, indicating distribution across networks was limited even though supply existed on multiple chains.
The verified data showed the month-end distribution rather than a month-on-month change, so this section records no shift in concentration. The top-10 network table and the top-3 concentration chart described circulating supply by chain, as DefiLlama tracked it, not transaction or payment volume.
Adjacent Segments
Yield-Bearing & Tokenized-Dollar Instruments
At end-May, the adjacent yield-bearing and tokenized-dollar segment stood at $4.60B, up $1.0B, or 28.2%, over the month. Tokenized commodities, including gold instruments, were essentially unchanged at $50M, down $0M and 0.7% MoM. These balances were not stablecoins and were not part of the stablecoin total: yield-bearing wrappers such as SUSDE, Ethena Staked USDe, and SUSDS, the staked USDS wrapper, were staked forms of underlying stablecoins already counted elsewhere, while standalone tokenized-treasury instruments such as USDY, Ondo US Dollar Yield, sat outside the stablecoin universe. The segment therefore represented adjacent capital reaching for yield, not stablecoin growth.
Instrument-level balances remained concentrated in the largest wrappers and tokenized-dollar products. SUSDS stood at $6.18B after adding $618M over the month, while USDY rose by $817M to $2.14B. SUSDE moved in the opposite direction, declining by $296M to $1.79B, and SYRUPUSDC, the syrupUSDC wrapper, increased by $188M to $1.39B. BFUSD was broadly unchanged at $1.32B after a $1M decline.
Smaller instruments showed more varied changes. SYRUPUSDT, the syrupUSDT wrapper, fell by $23M to $417M, whereas USDAI, the USDai instrument, rose by $40M to $289M. APYUSD, the apyUSD instrument, recorded the sharpest proportional increase among the smaller names in the table, adding $157M to end the month at $240M.
Backdrop & Developments
Macro & Crypto Backdrop
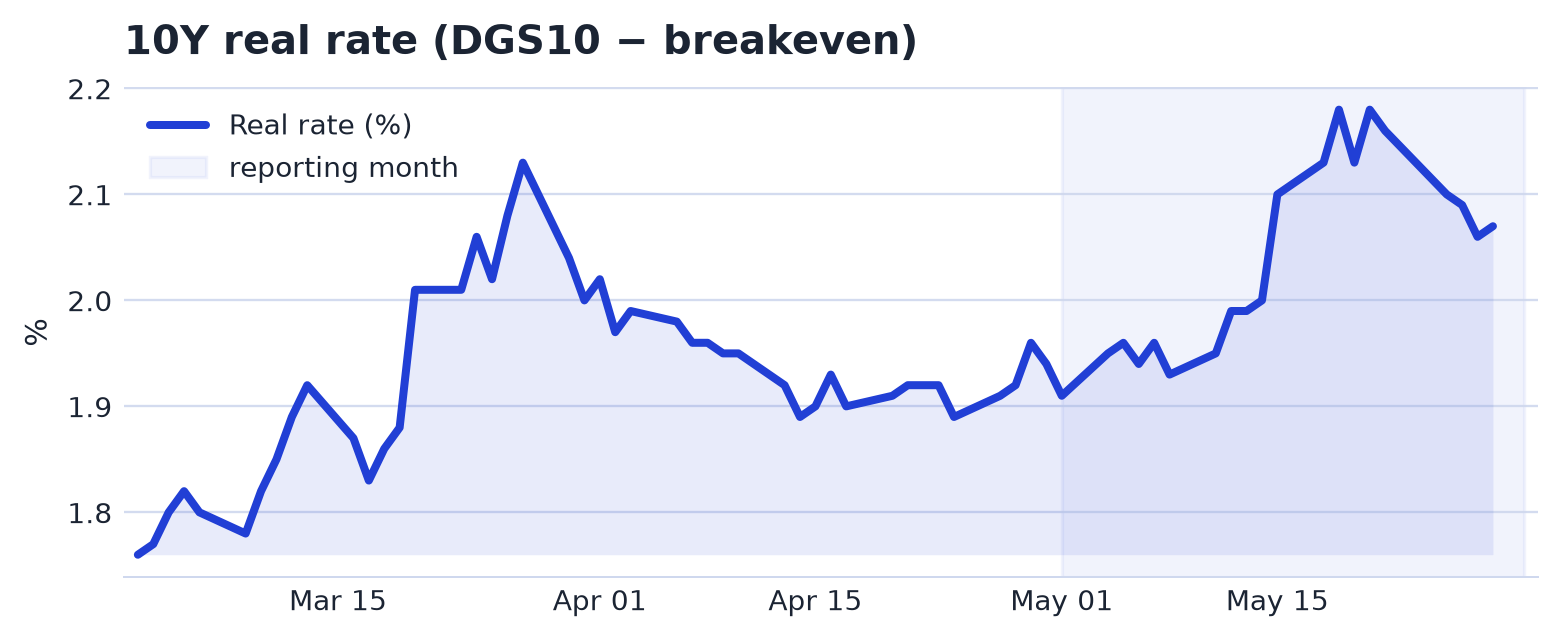
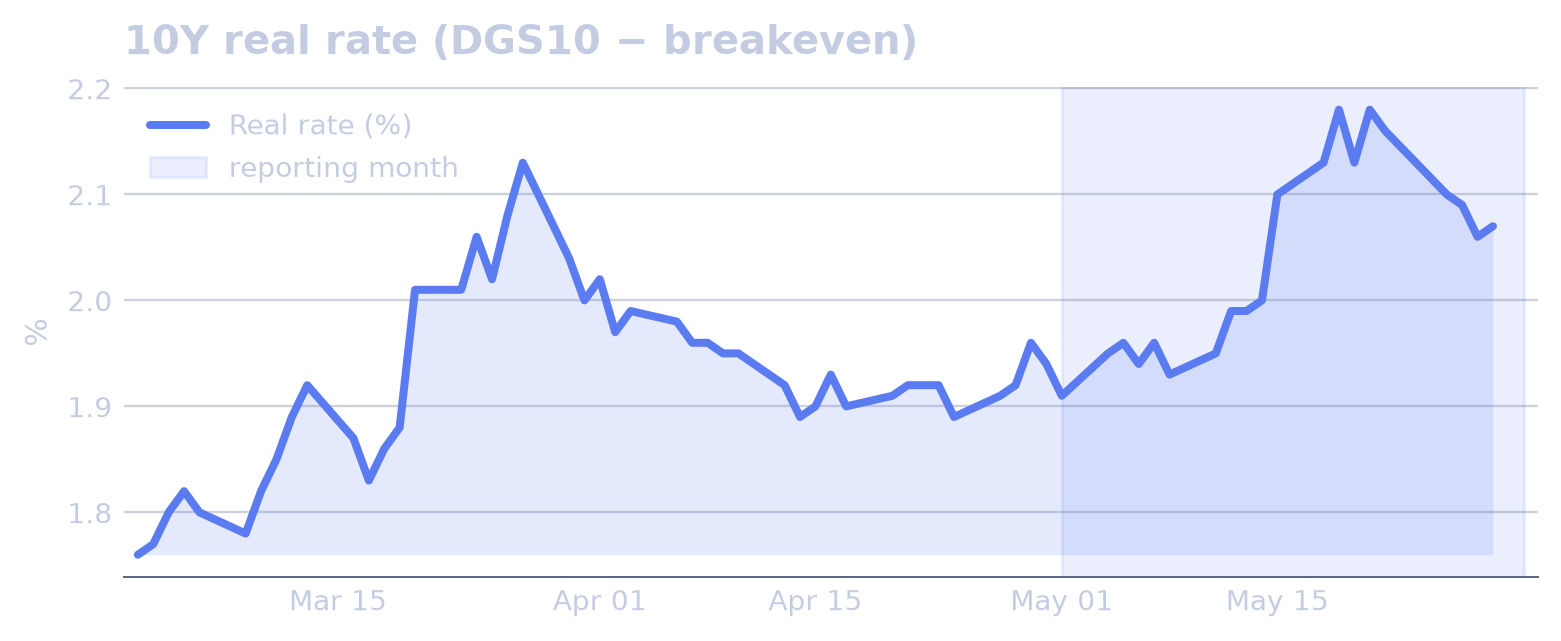
Rates and crypto ended May with firmer nominal and real rates and weaker digital-asset prices. The US 10Y yield rose from 4.39% to 4.45%, a +1.37% move, while the 10Y real rate increased from 1.91% to 2.07%, up +8.38%. The broad dollar index edged from 118 to 119, or +0.41%, and the VIX declined from 16.99 to 15.32, a -9.83% move. Bitcoin fell from $78,340 to $73,544, down -6.12%, BTC dominance slipped from 58.46% to 57.31%, down -1.98%, and Fear & Greed rose from 26.00 to 28.00, a +7.69% increase.
The macro context centred on the Iran war, the Strait of Hormuz, energy costs and US inflation, with repeated headlines on supply-chain exposure and oil-market stress. US inflation was reported at 3.8% in April, and PCE inflation was described as at a three-year high. During the month, DCOILWTICO, the WTI crude oil series, averaged 2.4σ above baseline, while T10YIE, 10Y breakeven inflation, averaged 2.2σ above baseline. Breakevens nevertheless registered two downside anomalies on 21 May, falling -2.05% day over day (-3.2σ) and -2.01% day over day (-3.1σ). The institutional policy context also shifted as Kevin Warsh was confirmed and then sworn in as Federal Reserve chair, while the Trump-Xi meeting in China formed the main trade-policy thread.
The main rate events were concentrated around mid-month. DGS10, the 10Y nominal yield, rose +2.68% day over day on 15 May (+3.3σ). On 16 May, the 10Y real rate recorded a mid-month level shift with a 3.6σ effect, driven by DGS10 at 71% of the move and T10YIE at 29%; the same day’s +5.00% day-over-day real-rate increase (+3.4σ) had DGS10 at 120% of the move and T10YIE at 20%. Later in the month, the yield_curve_2s10s rose +13.95% day over day on 26 May (+3.3σ), with DGS2, the 2Y nominal yield, accounting for 200% of that move and DGS10 for 100%.
News & Developments
Regulatory activity was prominent in May’s stablecoin news: CLARITY Act stablecoin yield rules were finalized in the US, while the EU opened a consultation on MiCA stablecoin rules and DeFi gaps. Licensing and market infrastructure moved in parallel, with Mastercard getting a New York BitLicense for direct stablecoin settlement and the SEC approving Paxos as a “blockchain-native” clearing agency.
US policy debate centred on the CLARITY bill, as banking associations said the stablecoin proposal still fell short of protecting bank deposits and objected to the yield wording. Senator Elizabeth Warren also asked Meta and Mark Zuckerberg for details on stablecoin plans ahead of CLARITY Act votes, while Augustus, an AI and stablecoin bank applicant, received conditional OCC approval. In the UK, the Bank of England chief said global stablecoin rules would “wrestle” with the US, and the Bank of England later reconsidered a strict stablecoin regime.
Among institutional and payments developments, JPMorgan said it would launch a tokenized money market fund for stablecoin issuers, and Kraken parent Payward moved to buy Reap in a $600M stablecoin payments push. Coinbase expanded its branded stablecoin infrastructure business with the Flipcash USDF launch, while AWS unveiled AI-agent payments based on stablecoins.
On enforcement and incidents, Tether froze over $500M of USDT in 30 days, according to BlockSec data, and Arkham mapped Iran central bank wallets after a $344M USDT freeze. StablR’s euro and US dollar stablecoins depegged after a $2.8M exploit.
Published by Stablecoin Beat · free to read and cite under CC BY 4.0. · Download the PDF · All reports · Methodology